Apex Bio is dedicated to serving the needs of the research community by manufacturing Bio analytical reagents of the highest quality.
Their portfolio covers research areas which include Apoptosis, Epigenetics and Cancer Biology, their speciality is drug screening libraries and inhibitors.
They can supply customised bioactive screening libraries which allow the scientist to select compounds, sizes, format and plate map.
Publications citing Apex Bio products include Nature, Nature Biotechnology, Scientist and Cell.
We also provide customized bioactive screening libraries that allow you to choose the compounds, the sizes, the quantities, the format (powder or solution) and plate map you want in the library
Cost-effective and competitive price to save your findings.
Potent, selective and cell-permeable in inhibiting or activating target molecules.
Diverse in chemical structure and route of administration (oral/i.m/i.v injection etc.).
Detailed files describing potency, selectivity and applications etc.
Supported by published data from top peer-reviewed journals.
Guaranteed high quality with NMR and HPLC validation.
Bioactive Screening Libraries are ready-to-use chemical libraries used for drug discovery, lab drug screening, drug target identification, and other pharmaceutical-related applications. They are available for high-throughput screening (HTS) and high-content screening (HCS).
The libraries consist of over 2,500 small molecules with validated biological and pharmacological activities. The solubility, purity and stability of the compounds are also proved. Safety and effectiveness of the compounds has been demonstrated by literature, preclinical and clinical research, and many compounds are FDA-approved.
The collections of unique small molecules, which include inhibitors, antagonists and agonists. These compounds focused on hundreds of targets that are part of more than 20 signaling pathways or research areas, which include DNA Damage/DNA Repair, Cell Cycle/Checkpoint, JAK/STAT Signaling Pathway, MAPK Signaling Pathway, GPCR/G protein, Angiogenesis, Immunology/Inflammation, Endocrinology and Hormones, Cancer Biology, Metabolism, Stem Cell, etc.
We also provide customized bioactive screening libraries that allow you to choose the compounds, the sizes, the quantities, the format (powder or solution) and plate map you want in the library.
Apexbio’s analytical team has over 20 years of experience in analytical chemistry and offers a wide range of services at competitive prices. Our expertise covers many classes of naturally occurring biomarkers and synthetic compounds including eicosanoids, lipids, carotenoids, carbohydrates, peptides, pharmaceuticals and many others. Our professional staff also specializes in HPLC purification of a wide range of products.
Quantitative Analysis
GC-MS and LC-MS/MS quantification of eicosanoids and other biomarkers in biological matrices (ABSciex API 4000)
HPLC-UV and HPLC-FLD quantification of active ingredients (cosmetics, formulations, etc)
Residual solvents testing
Karl-Fisher water analysis
Qualitative Analysis
Compound identification (NMR, MSn, GC-MS, FTIR)
HPLC-MS
Optical rotation
Contract Purifications
Chiral method development and purification
mg to kg scale purifications
Peptides
Ultra high purity working standards
Preparative and semipreparative HPLC instrumentation
For more information or to receive a quote for contract services please contact us
Apexbio has an experienced team of chemists with a depth of knowledge and experience in complex organic syntheses including prostaglandins, leukotrienes, cannabinoids, fatty acids, heterocyclic chemistry, and pheromones. Our sales staff and chemists will quickly respond to your custom synthesis inquiries with competitive pricing and aggressive lead times. Apexbio has a proven track record of supplying academia, pharmaceutical, and biotechnology companies with the synthesis of novel organic compounds, process development, and manufacturing of high purity pharmaceutical and fine organic chemicals in milligram to process scale batches with on-time delivery.
Apexbio provides high quality custom peptide synthesis services for the life science research with a success rate well above the industry standard. We offer a complete range of peptide synthesis services ranging from bulk API peptides to high throughput library peptides and array peptide preparation. We have both liquid phase and solid phase Fmoc-chemistry. Liquid Phase Peptide Synthesis is used for the synthesis of very short peptides such as dipeptides, while Solid Phase Peptide Synthesis is well suited for preparing biologically active peptides including long, difficult and hydrophobic peptides.
Apexbio also provides a large number of peptide modifications as well as custom peptides for diagnostic and therapeutic applications.
We emphasize providing high quality peptides at a competitive price. All peptides synthesized are provided with a mature quality control package, which includes HPLC chromatograms to ensure purity and mass spectral analysis to confirm identity.
Peptide synthesis services
Peptide Synthesis
Peptide Modifications
Peptide Library Services
Application Areas
Cancer immunotherapy
Self-assembling peptide
Peptide Venom Peptides
Peptide Natriuretic Peptides
Neurodegenerative Disease Peptides
Milk-derived peptide therapies
Antimicrobial Peptides
Cancer immunotherapy: Cancer immunotherapy uses the body’s own immune system to attack cancer cells. Peptide-based vaccines use tumor-associated antigens that associate with T cells to target cancer.
Self-assembling peptide: Self-assembling peptides are short, synthetic peptides characterized by amphipathic sequences. These peptides are able to spontaneously self-assemble in aqueous solution to form highly organized structures such as hydrogels. APExBIO can synthesize hydrophobic self-assembling sequences at high quantity and purity.
Peptide Venom Peptides: Bioactive peptides are the most dominant component of animal venoms. Venom peptides can vary in length and complexity, thus their synthesis requires a combination of chemical and recombinant synthesis.
Peptide Natriuretic Peptides: Functioning in the induction of natriuresis, (the excretion of large amounts of sodium in the urine), natriuretic peptides have been touted as useful biomarkers for the purpose of personalized heart failure treatments and are involved in maintaining heart pressure and volume, as well as regulating cardiovascular remodeling pathways. APExBIO offers custom synthesis of natriuretic peptides and natriuretic peptide products.
Neurodegenerative Disease Peptides: A pathological hallmark of neurodegenerative diseases is the abnormal aggregation of extracellular or intracellular peptides and proteins such as beta amyloid, tau, prions, and polyQ-hHtt. Custom peptides can be used to study aggregation, and develop aggregative inhibitors and vaccines.
Milk-derived peptide therapies: Nutrition aside, milk has gained recognition as a rich source of potentially therapeutic proteins and peptides that have a variety of functions, such as antimicrobial, antiviral, antioxidant, immunostimulant, and anti-hypertension activities.
Antimicrobial Peptides: The prevalence of antibiotic-resistant microbes continues to hinder the treatment of a variety of diseases. Custom peptides can be used to develop intelligently designed antimicrobial drugs
Visit our Peptides Catalog for a full list of our catalog peptides. For additional information, please contact us
Microorganisms are the most widespread organisms on the earth. Over 99% of them can not be isolated and cultured clonally, while traditional culture-dependent methods challenge the study of microorganisms in their natural environment . Based on microbial characteristics, researchers developed several culture-free ways to explore the diversity structure and functional genome of microorganisms. Now you can enjoy these services from APExBIO.
16S/18S/ITS Sequencing
1. Overview
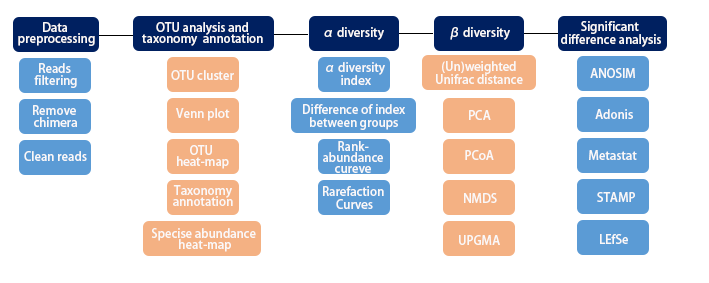
Amplicon sequencing uses the second and third generation sequencing platforms to perform high-throughput sequencing of specific products such as 16S rDNA, 18S rDNA and ITS, then analyzes the variation in the sequences, and obtain the microbial community structure, evolutionary relationship in environmental samples and so on. This technology breaks through the shortcomings that most traditional microorganisms cannot be cultivated, 16S/18S/ITS Sequencing can directly sequence genetic material that is directly recovered from environmental samples. The services provided by APExBIO can benefit research such as the exploration of biodiversity.
2. Workflow
3. Applications
3.1 Specific gut microbiome signature predicts the early-stage lung cancer
Abstract
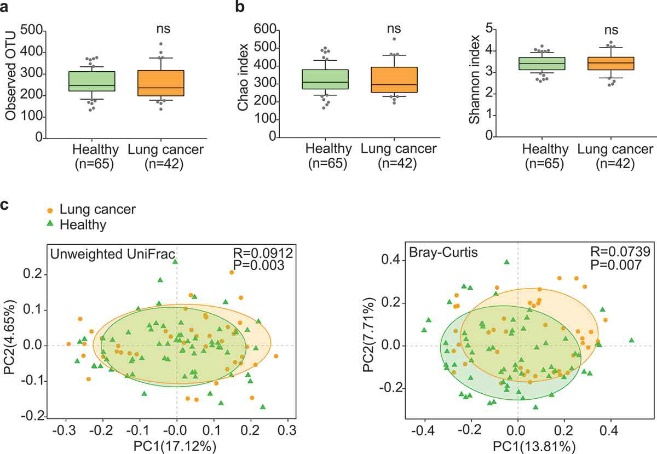
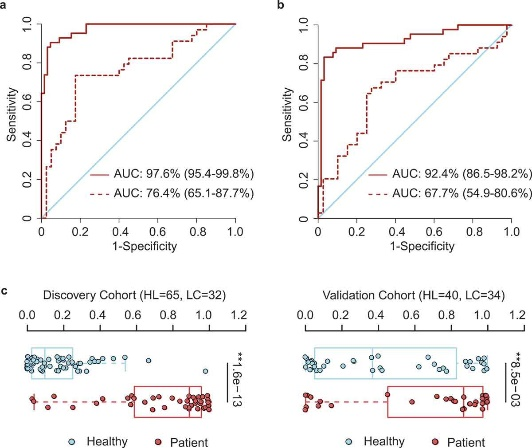
Alterations of gut microbiota have been implicated in multiple diseases including cancer. However, the gut microbiota spectrum in lung cancer remains largely unknown. Here we profiled the gut microbiota composition in a discovery cohort containing 42 early-stage lung cancer patients and 65 healthy individuals through the 16S ribosomal RNA (rRNA) gene sequencing analysis. We found that lung cancer patients displayed a significant shift of microbiota composition in contrast to the healthy populations. To identify the optimal microbiota signature for noninvasive diagnosis purpose, we took advantage of Support-Vector Machine (SVM) and found that the predictive model with 13 operational taxonomic unit (OTU)-based biomarkers achieved a high accuracy in lung cancer prediction (area under curve, AUC = 97.6%). This signature performed reasonably well in the validation cohort (AUC = 76.4%), which contained 34 lung cancer patients and 40 healthy individuals. To facilitate potential clinical practice, we further constructed a ‘patient discrimination index’ (PDI), which largely retained the prediction efficiency in both the discovery cohort (AUC = 92.4%) and the validation cohort (AUC = 67.7%). Together, our study uncovered the microbiota spectrum of lung cancer patients and established the specific gut microbial signature for the potential prediction of the early-stage lung cancer.
Figure 3.1.1 Gut microbiota dysbiosis in lung cancer patients. (a) Numbers of OTUs observed in patients and healthy controls. (b) Microbial richness based on the Chao index and diversity based on the Shannon index. The box represented the interquartile range (IQR) between the first and the third quartiles, and the midline represented the median. Whiskers extended to values within 1.5 times IQR. Circles indicated outliers beyond the whiskers. (c) Principal coordinates analysis (PCoA) for lung cancer (orange) and healthy control samples (green). Left, Unweighted UniFrac; right, Bray–Curtis. Significant differences were observed between patients and healthy controls with ANOSIM test (UniFrac, R = 0.0912, P = .003; Bray–Curtis, R = 0.0739, P = .007). The first two principal coordinates (PCs) were each labeled with the percentage of variance explained.
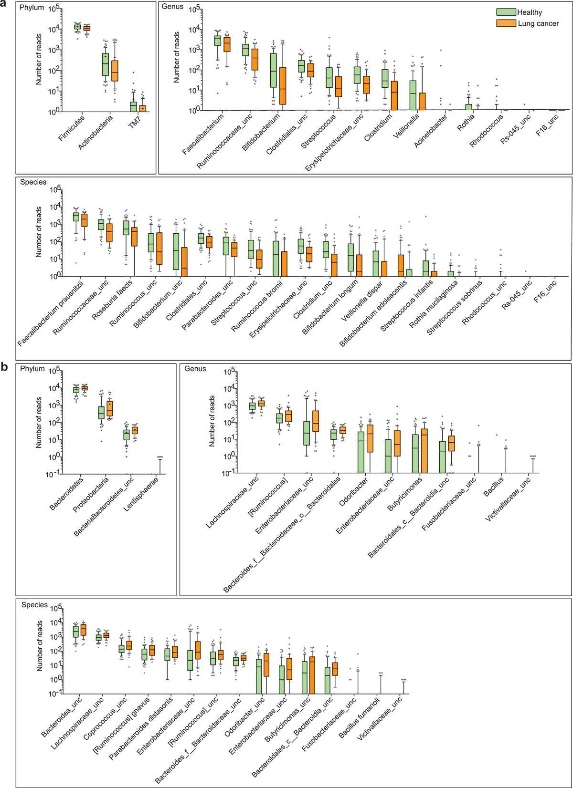
Figure 3.1.2 Differential abundance of gut microbiota in lung cancer and healthy controls. The taxa decreased (a) and increased (b) in patients with lung cancer at the phylum, genus, and species levels, p < .05. Green and orange represented the healthy controls (n = 65) and lung cancer patients (n = 42), respectively. The distributions of taxa were based on the number of reads post-filtering and rarefying. The abundance in each group was plotted as log10 scale on the y axis. P values were calculated using the two-tailed Wilcoxon rank-sum test. Description of boxplots was the same as in Figure 3.2.1. Taxa were named as their lowest possible level of classification, with unclassified (unc) indicating no further classification available.
Figure 3.1.3 OTU-based diagnostic biomarkers for lung cancer. (a, b) Receiver operating characteristic (ROC) curves of prediction efficacy for the OTU-based predictors using SVM (a) and PDI (b), respectively. Solid and dashed lines indicated the discovery (patient = 42, healthy = 65) and validation (patient = 34, healthy = 40) cohorts, respectively. (c) PDI distributions in early-stage patients and healthy controls. Two-tailed Wilcoxon rank-sum test, **p < .01.
3.2 Spatiotemporal dynamics of the archaeal community in coastal sediments: assembly process and co-occurrence relationship
Abstract
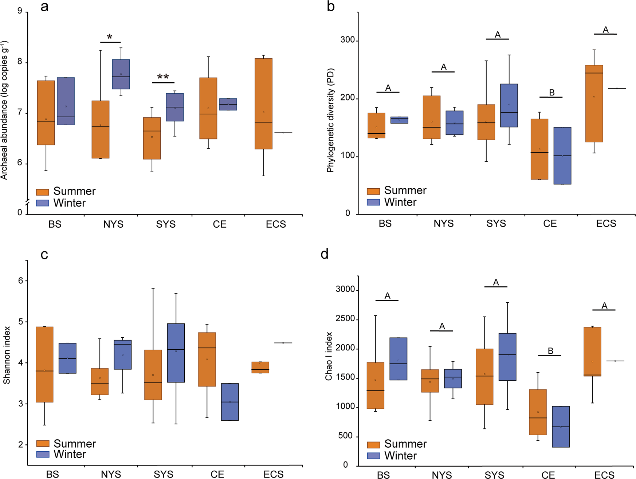
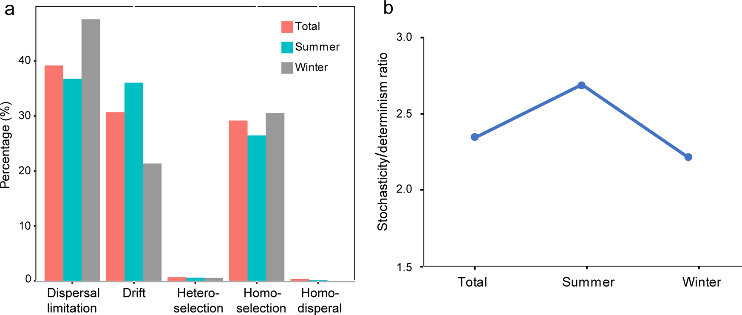
Studies of marine benthic archaeal communities are updating our view of their taxonomic composition and metabolic versatility. However, large knowledge gaps remain with regard to community assembly processes and inter taxa associations. Here, using 16S rRNA gene amplicon sequencing and qPCR, we investigated the spatiotemporal dynamics, assembly processes, and co-occurrence relationships of the archaeal community in 58 surface sediment samples collected in both summer and winter from across ~1500 km of the eastern Chinese marginal seas. Clear patterns in spatiotemporal dynamics in the archaeal community structure were observed, with a more pronounced spatial rather than seasonal variation. Accompanying the geographic variation was a significant distance-decay pattern with varying contributions from different archaeal clades, determined by their relative abundance. In both seasons, dispersal limitation was the most important process, explaining ~40% of the community variation, followed by homogeneous selection and ecological drift, that made an approximately equal contribution (~30%). This meant that stochasticity rather than determinism had a greater impact on the archaeal community assembly. Furthermore, we observed seasonality in archaeal co-occurrence patterns: closer inter-taxa connections in winter than in summer, and unmatched geographic patterns between community composition and co-occurrence relationship. These results demonstrate that the benthic archaeal community was assembled under a seasonal-consistent mechanism but the co-occurrence relationships changed over the seasons, indicating complex archaeal dynamic patterns in coastal sediments of the eastern Chinese marginal seas.
Figure 3.2.1 16S rRNA gene copy numbers derived from qPCR (a) and indices of alpha diversity shown as phylogenetic diversity (b), Shannon (c) and Chao I (d). Significant differences between seasons in each sampling area are marked by stars (**P < 0.01; *P < 0.05). Significant differences between sampling areas are marked by different capital letters. BS, Bohai Sea; NYS, north Yellow Sea; SYS, south Yellow Sea; ECS, East China Sea; CE, Changjiang Estuary.
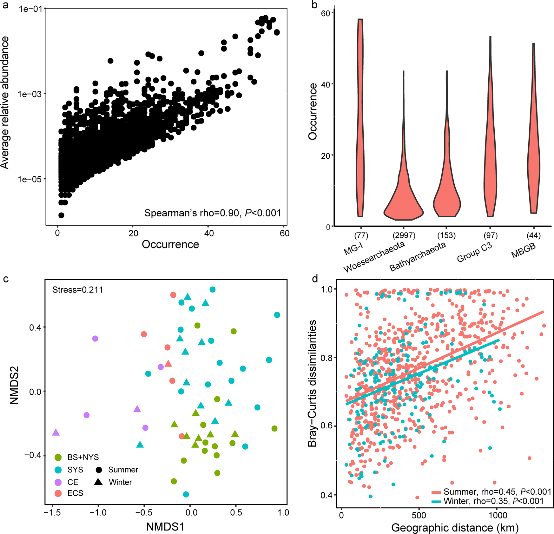
Figure 3.2.2 a. Abundance–occupancy relationship based on all OTUs. Spearman’s rank correlation was calculated between average relative abundance and numbers of site occurred; b. Occurrence patterns of OTUs belonging to the top five most abundant archaeal clades. Numbers in parenthesis indicate the number of OTUs for each clade; c. Ordination of community using the non-metric multidimensional scaling based on Bray–Curtis dissimilarities; d. Pairwise relationships between Bray–Curtis dissimilarities and geographic distances for both winter and summer samples. Spearman’s rank correlations were calculated.
Figure 3.2.3 a. Relative contribution of different ecological processes; b. The ratio of stochasticity and determinism.
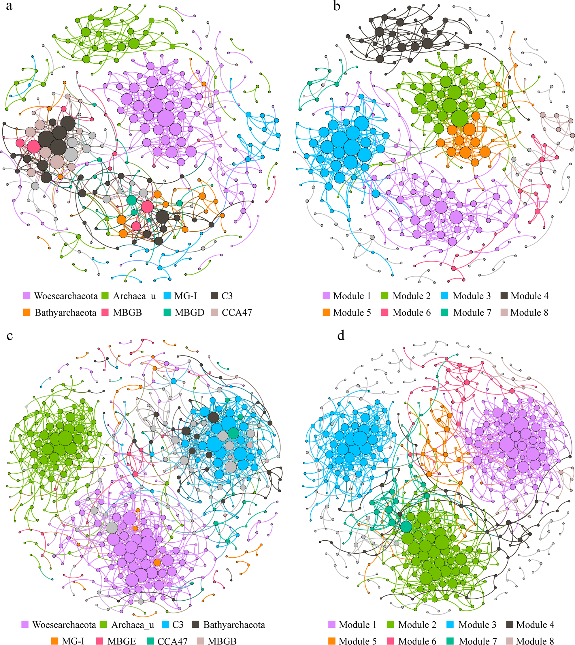
Figure 3.2.4 Each shown connection has a correlation coefficient >|0.7| and a P value < 0.01. The size of each node is proportional to the number of connections. The upper panel shows the network of summer samples with OTUs colored by taxonomy (a) and modularity (b); the lower panel shows the network of winter samples with OTUs colored by taxonomy (c) and modularity (d).
4. References
[1] Yajuan Zheng, Zhaoyuan Fang, Yun Xue, Jian Zhang, Junjie Zhu, Renyuan Gao, Shun Yao, Yi Ye, Shihui Wang, Changdong Lin, Shiyang Chen, Hsinyi Huang, Liang Hu, Ge-Ning Jiang, Huanlong Qin, Peng Zhang, Jianfeng Chen & Hongbin Ji (2020) Specific gut microbiome signature predicts the early-stage lung cancer, Gut Microbes, 11:4, 1030-1042, DOI: 10.1080/19490976.2020.1737487
[2] Liu J, Zhu S, Liu X, Yao P, Ge T, Zhang XH. Spatiotemporal dynamics of the archaeal community in coastal sediments: assembly process and co-occurrence relationship. ISME J. 2020 Jun;14(6):1463-1478. doi: 10.1038/s41396-020-0621-7. Epub 2020 Mar 4. PMID: 32132664; PMCID: PMC7242467.
Metagenomics Sequencing
1. Overview
Microorganisms are the most widespread organisms on the earth. Over 99% of natural microorganisms cannot be isolated and cultured clonally, while traditional isolation and culture-dependent methods challenge the study of microorganisms in their natural environment. Based on microbial characteristics,researchers developed several culture-free ways to explore the diversity structure and functional genome of microorganisms. Metagenomics is one of them.
Unlike 16S/18S/ITS Sequencing, which only targets specific microorganisms, metagenomic research takes all microorganism genomes in the environment as the research objects. The metagenomic service provided by APExBIO uses high-throughput sequencing of whole-genome DNA in environmental samples to obtain the data of a single sample. Then, based on de novo assembly, analyze the diversity of the microbial community structure, the genetic composition of the microbial population, and the metabolic pathways related to the specific environment, to further explore valuable genes and interrelationships within the microbial community.
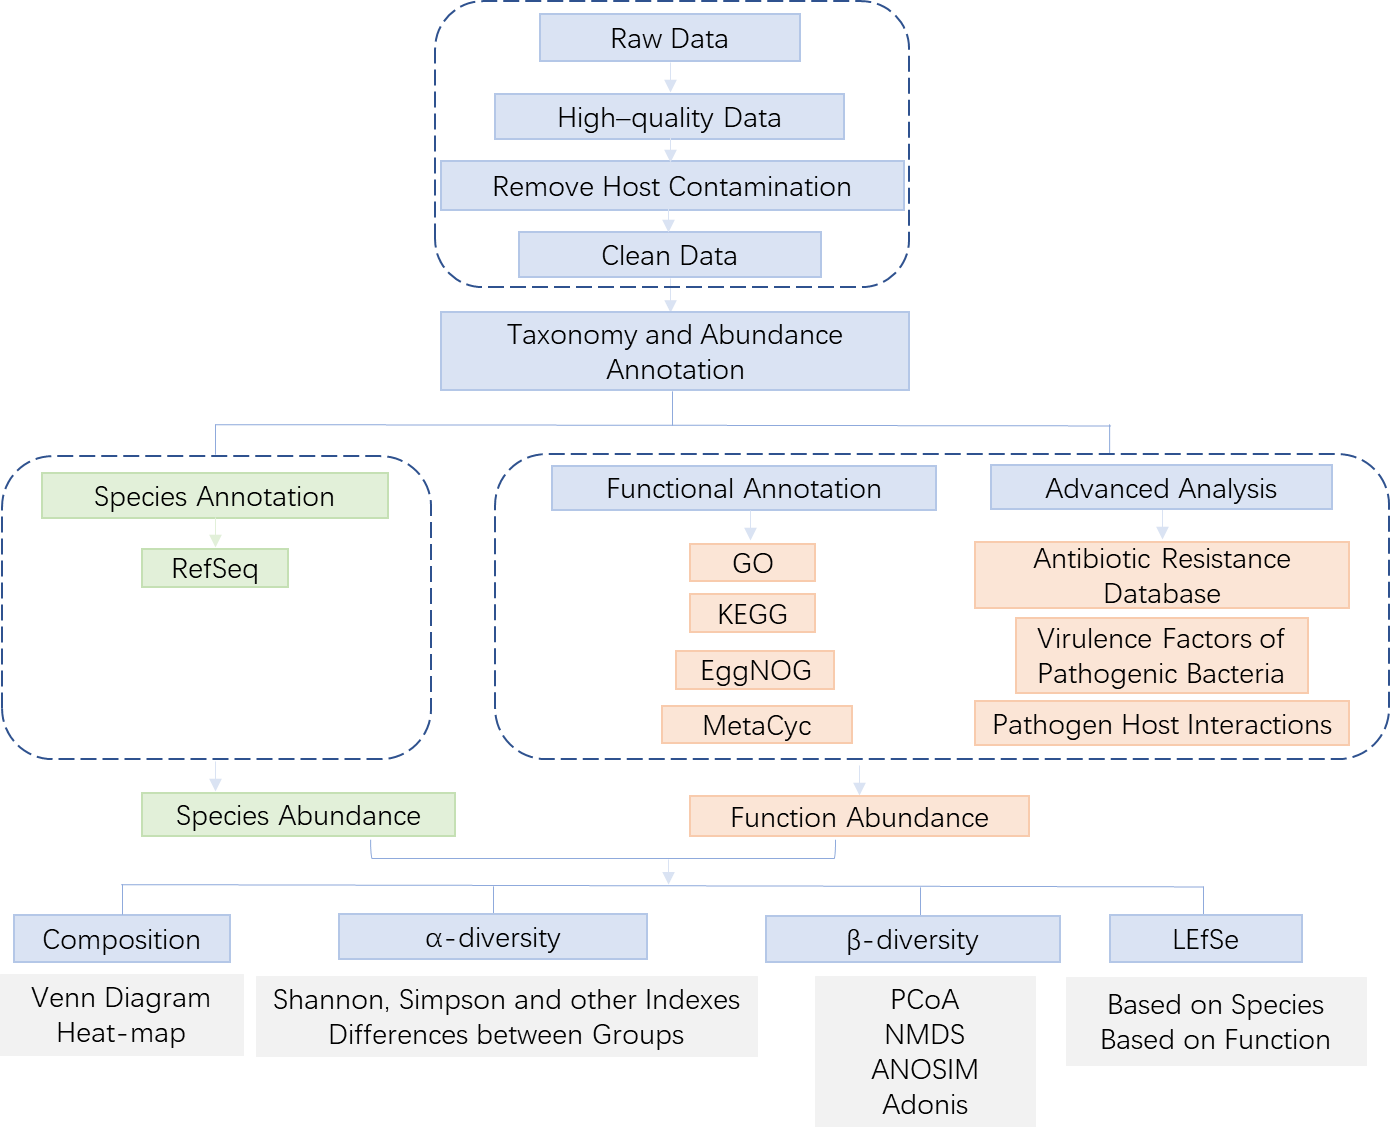
2. Workflow
2.1 Library preparation & Sequencing
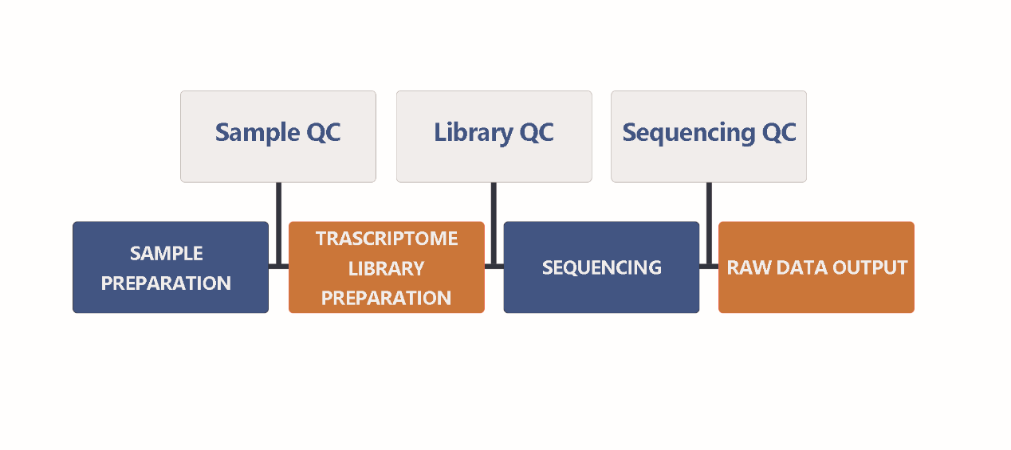
When we received your sample(s), the sample quality test will be conducted first. Then we use qualified DNA sample(s) to construct library(s). After that, we will conduct library quality test. And finally, the qualified library(s) will be used for sequencing (Illumina PE150). The bioinformatics analysis will be carried on with sequencing data (Raw data). In order to provide high-quality data for you, each step of sample testing, library construction and sequencing is strictly controlled by APExBIO.
Our experimental procedures are shown in Figure2.1.
Figure 2.1 Experimental Procedures
2.2 Bioinformatics Analysis
Figure 2.2.0 Bioinformatics Analysis Workflow
3. Applications
3.1 The Alterations of Vaginal Microbiome in HPV16 Infection as Identified by Shotgun Metagenomic Sequencing
3.1.1 Abstract
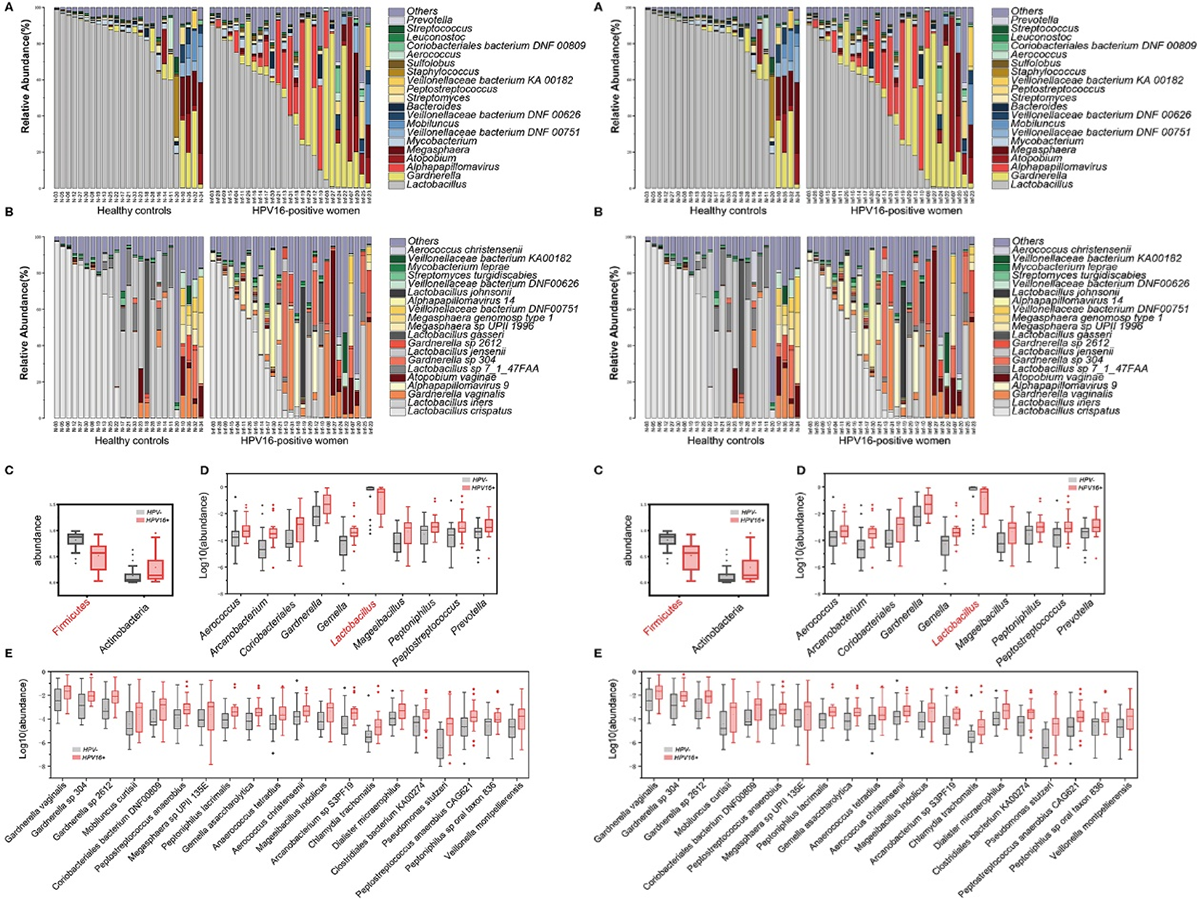
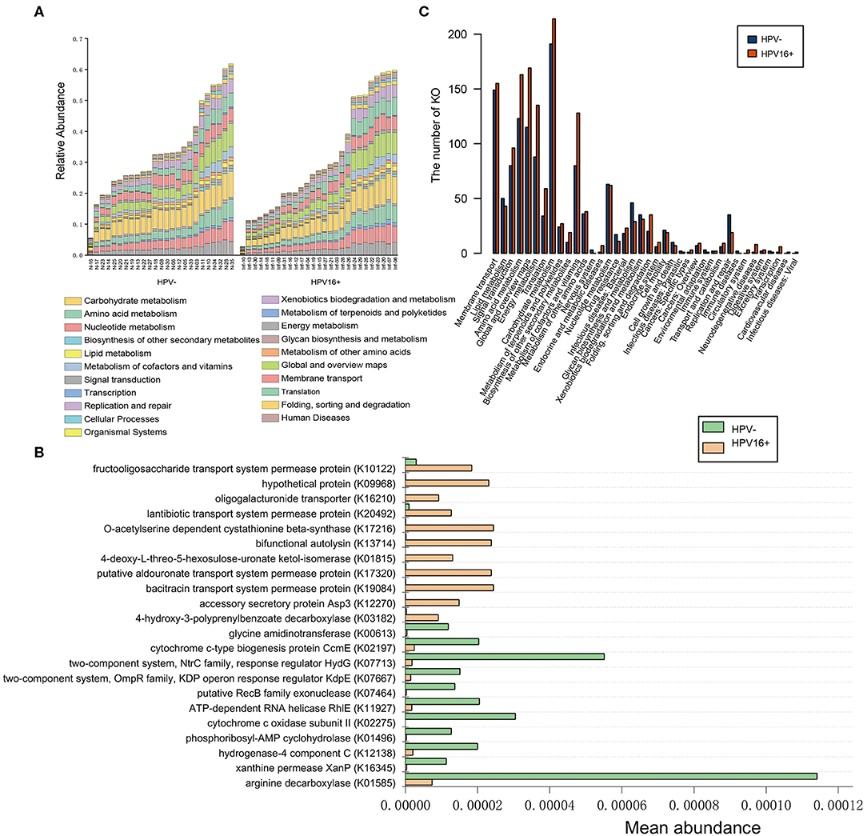
The association of microbiome imbalance with cancer development is being one of the research hotspots. Persistent HPV infection is a causal event in cervical cancer initiation, but, little is known about the microbiome composition and function in HPV infection. Here we identified the compositional and functional alterations on vaginal samples from 27 HPV16 positive women and 25 age-matched HPV negative controls using shotgun metagenomic sequencing, to provide a comprehensive investigation describing the microbial abundances and enriched metabolic functions in cervicovaginal metagenomes. We further employed qPCR assays to evaluate two selected gene markers of HPV16 infection in an independent validation cohort consisting of 88 HPV16 positive women and 81 controls, and six selected species markers in a subset of validation cohort of 45 HPV16 positive women and 53 controls. We found that the relative abundance of dominant Firmicutes was lower, Actinobacteria, Fusobacteria and viruses phyla were significantly higher in the HPV16-positive group; 77 genera including Gardnerella, Peptostreptococcus, and Prevotella were higher, and 20 genera including Lactobacillus and Aerococcus were lower in the HPV16-positive women. Abundance of 12 genes, 17 genera, and 7 species biomarkers showed an excellent predictive power for the HPV16-positive individuals, with 0.861, 0.819, and 0.918, respectively, of the area under the receiver-operating characteristic curve (AUC). We further characterized the microbial function, and revealed that HPV16-positive women were enriched in metabolism and membrane transport, and depleted by glycan biosynthesis and metabolism, and replication and repair. Quantitative PCR measurements validated that one gene marker and three species were significantly enriched in HPV16-positive women. These results highlight a fundamental fact that there are altered composition and function of the vaginal microbiome in HPV16-positive women, suggesting that vaginal dysbiosis may be associated with HPV infection in the female genital tract.
Figure 3.2.1 Phylogenetic profiles in vaginal microbes between HPV16-positive women and controls. Composition of vaginal microbiota in two groups at the genus level (A) and species level (B). Comparison of differentially abundant phylotypes identified by the Wilcoxon rank-sum test, at phyla (C), genera (D), and species (E) level, respectively. Only the top 2 phyla, top 10 genera and top 20 species are shown. The phylotypes enriched in the control group are colored with red. The relative abundances are shown by boxplot. Boxes represent the interquartile ranges, lines inside the boxes denote medians, and “+” denotes means.
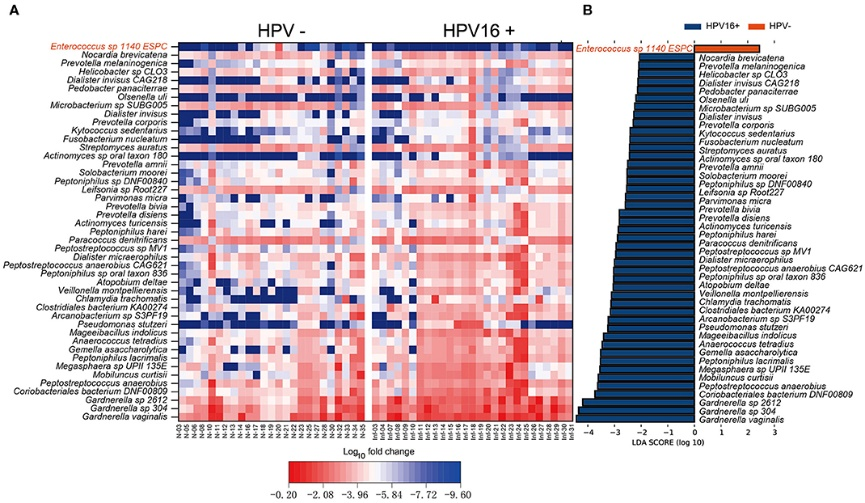
Figure 3.2.2 Vaginal microbiome as HPV16-infection markers. (A) Heatmap showing the relative fold change of bacterial species in HPV16 infection. The species enriched in controls are colored with red. (B) Histogram of the LDA scores computed for species differentially abundant between HPV16-positive women and controls. The LDA scores (log10) > 2 are listed.
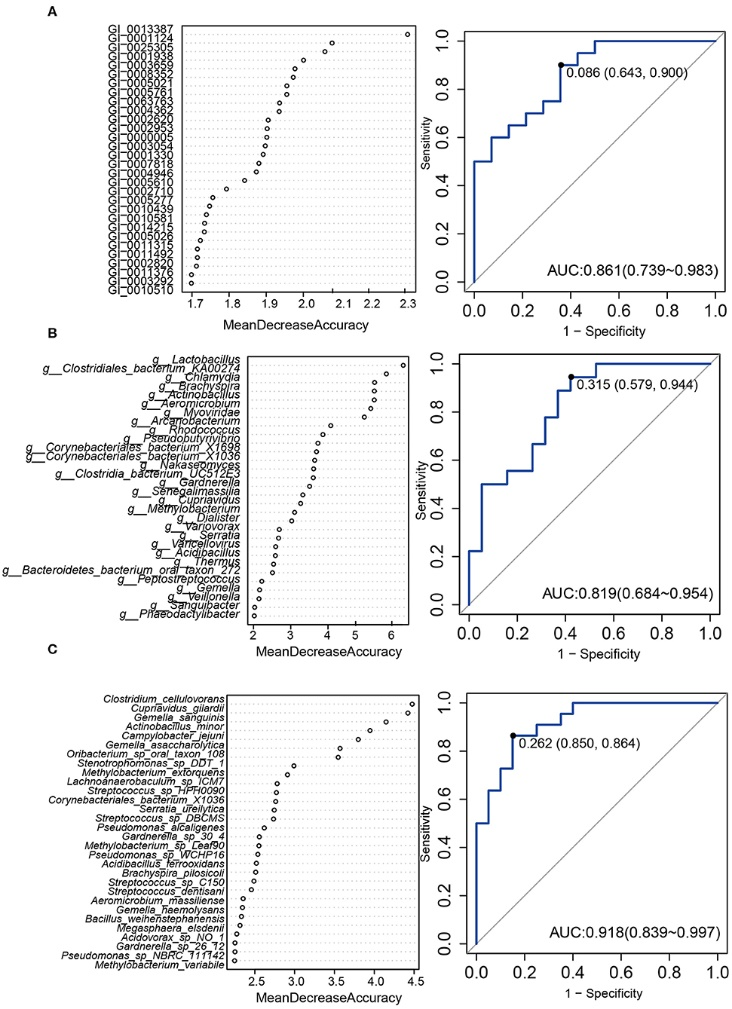
Figure 3.2.3 A predictive model of importance based on the gene/genus/species-level abundance profile using random forests (RF). The relative importance of each gene (A)/genus (B)/species (C) in the predictive random forest model using the mean decreasing accuracy. ROC curve generated by the RF using 12 genes (A)/17 genus (B)/7 species (C) in the vaginal microbiota. The plots shown in the ROC represent the corresponding optimal threshold.
Figure 3.2.4 Functional predictions for the vaginal microbiome of the HPV16-positive and control groups. (A) The abundance of each sample at level 2 metabolic pathway. (B) The KOs with significantly different abundances in the vaginal microbiome identified by Metastats analysis (P, FDR < 0.05). (C) Comparison between the HPV16-positive group-enriched and the control-enriched KO markers on level 2 of the KEGG functional category.
4. References
[1] Yang Q, Wang Y, Wei X, Zhu J, Wang X, Xie X and Lu W (2020) The Alterations of Vaginal Microbiome in HPV16 Infection as Identified by Shotgun Metagenomic Sequencing. Front. Cell. Infect. Microbiol. 10:286. doi: 10.3389/fcimb.2020.00286
Metatranscriptome Sequencing
1. Overview
Metatranscriptome refers to the total content of gene transcripts in a community and varies with time and environmental changes. The techniques applied to obtain the whole expression profile in a community and to follow the dynamics of gene expression patterns over time or environmental parameters are known as metatranscriptomics. It improves our understanding of the structure, function, and adaptive mechanisms in complex communities and, together with other “omics,” is applied to fields such as medicine, biotechnology, and, particularly, in microbial ecology. Compared with the metagenomics, metatranscriptome sequencing can give us better understanding of complex microbial communities from the transcription level.APExBIO uses advanced sequencing platforms, which have high-throughput coverage that can comprehensively detect microbial information in the environment, We will help you explore the microbial diversity and dynamic changes in the sample.
3. Applications
3.1 Tibet plateau probiotic mitigates chromate toxicity in mice by alleviating oxidative stress in gut microbiota
Abstract
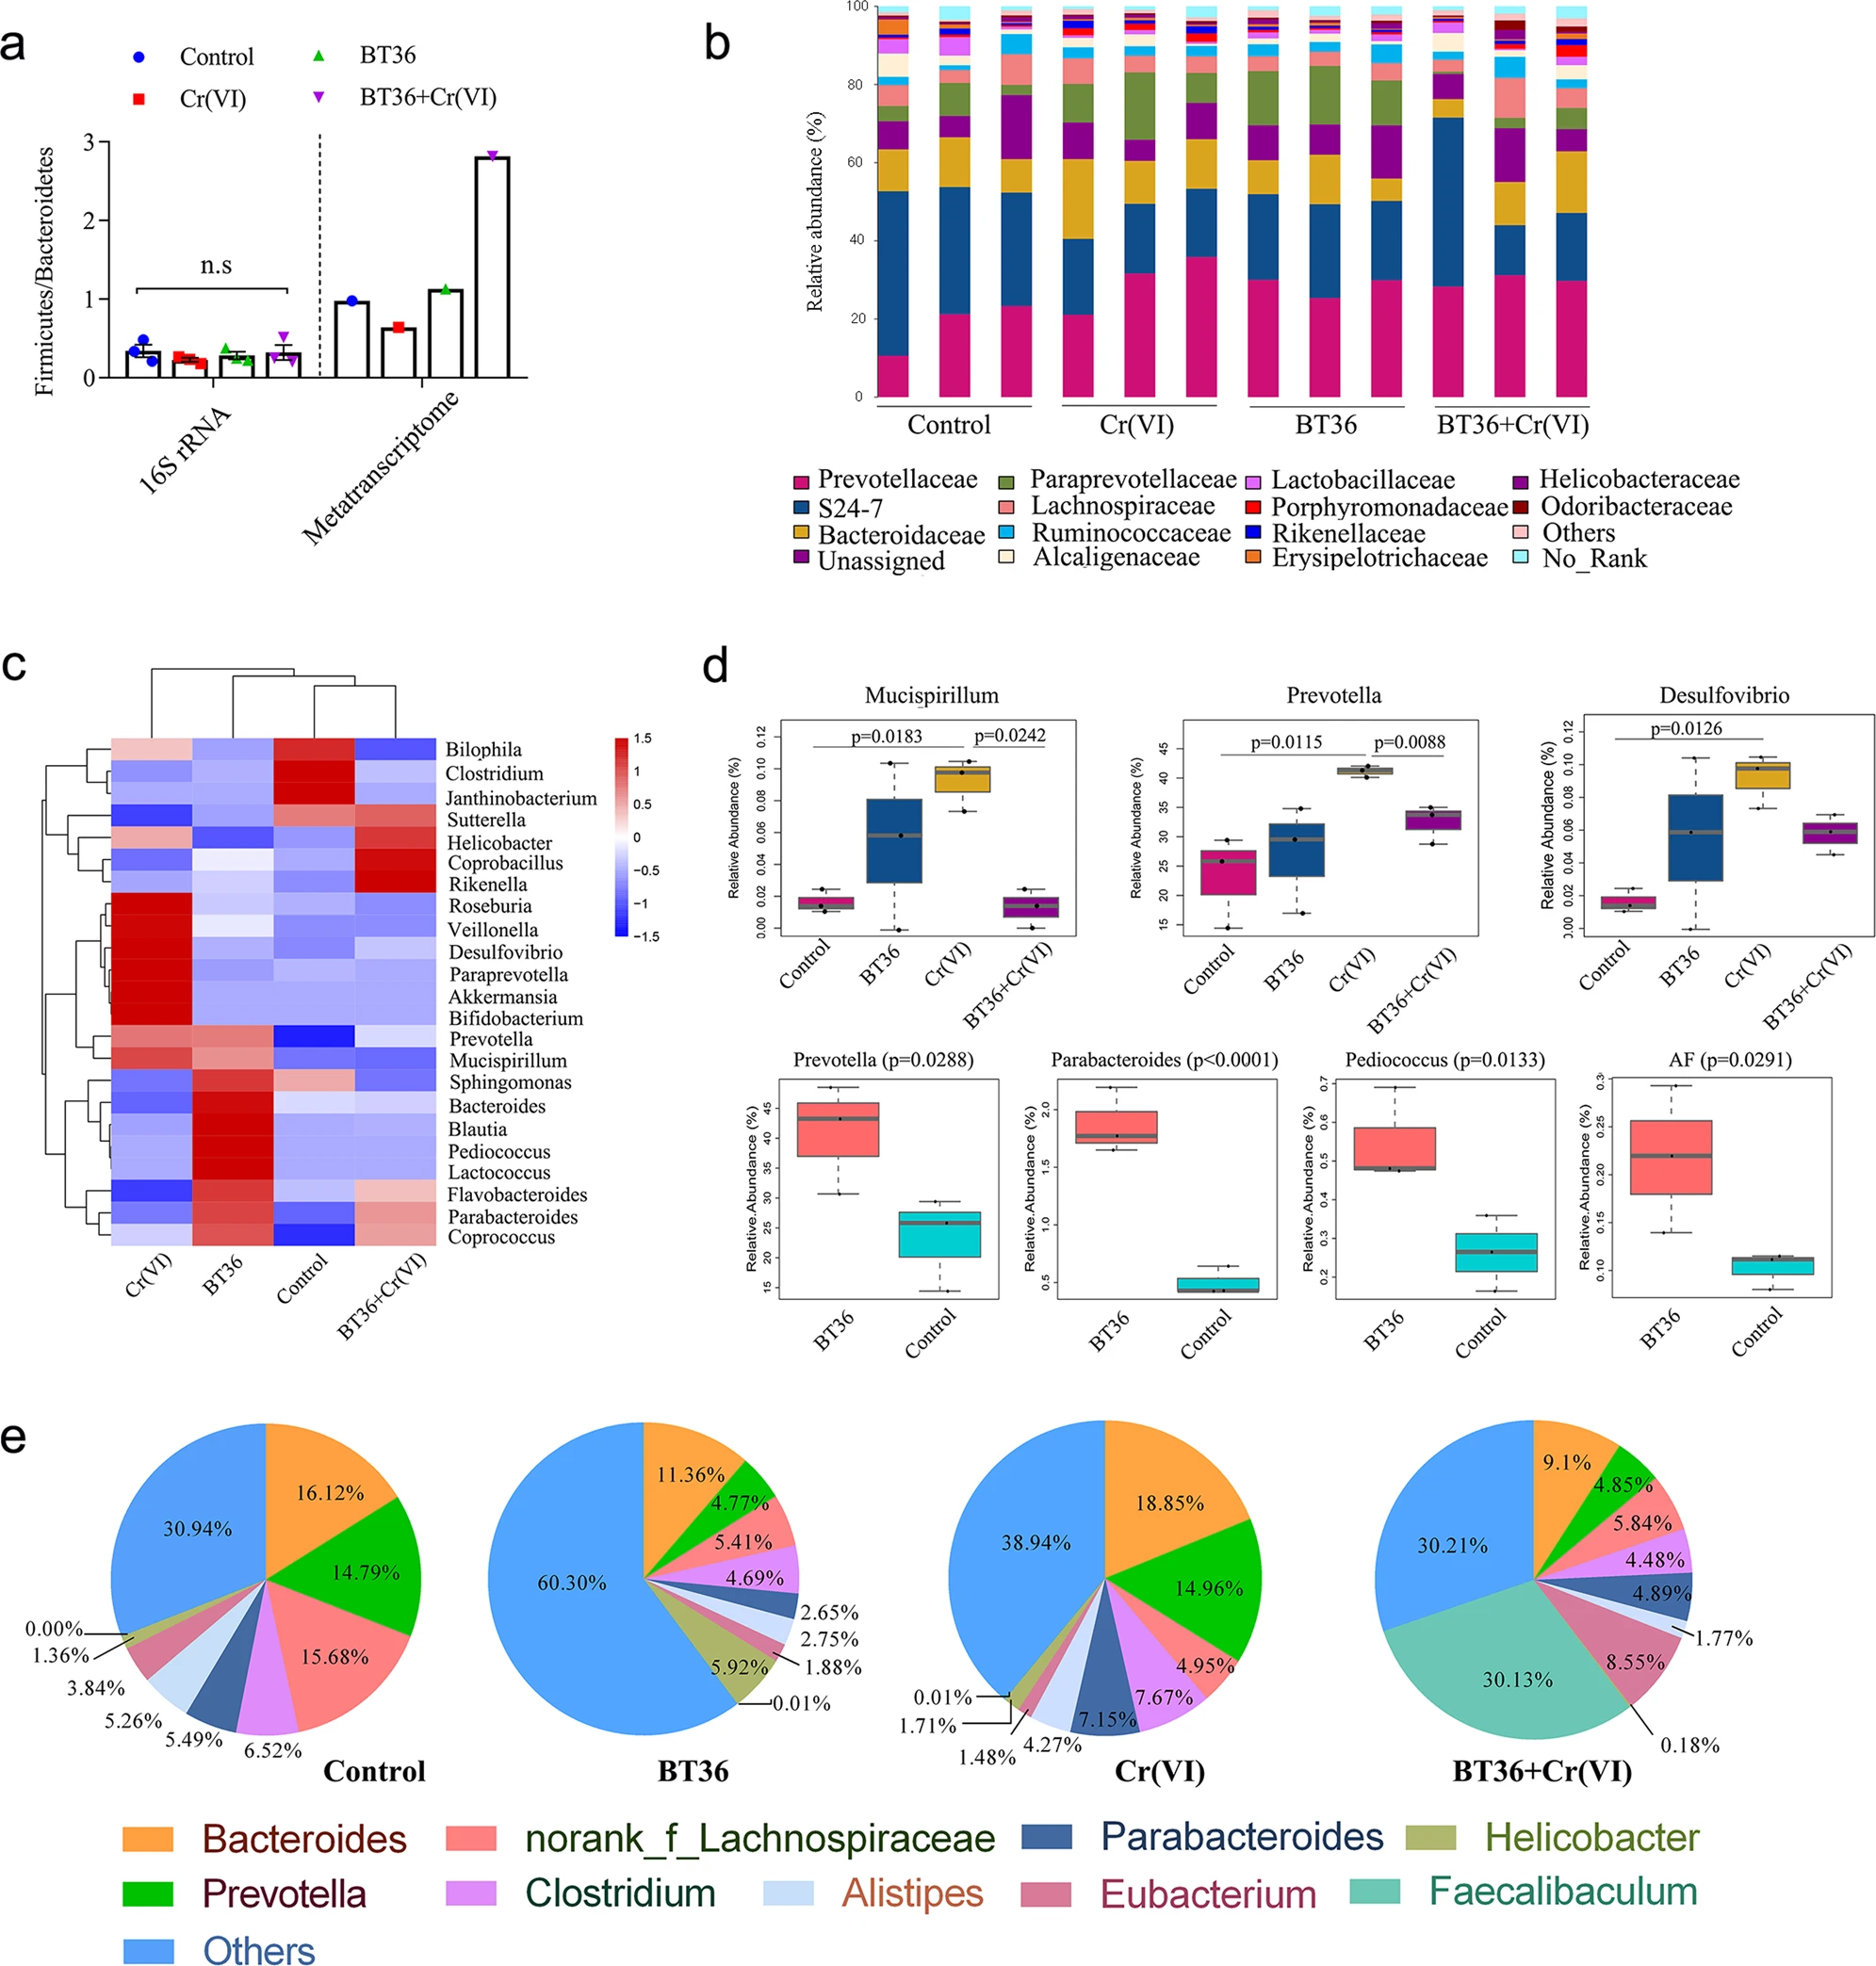
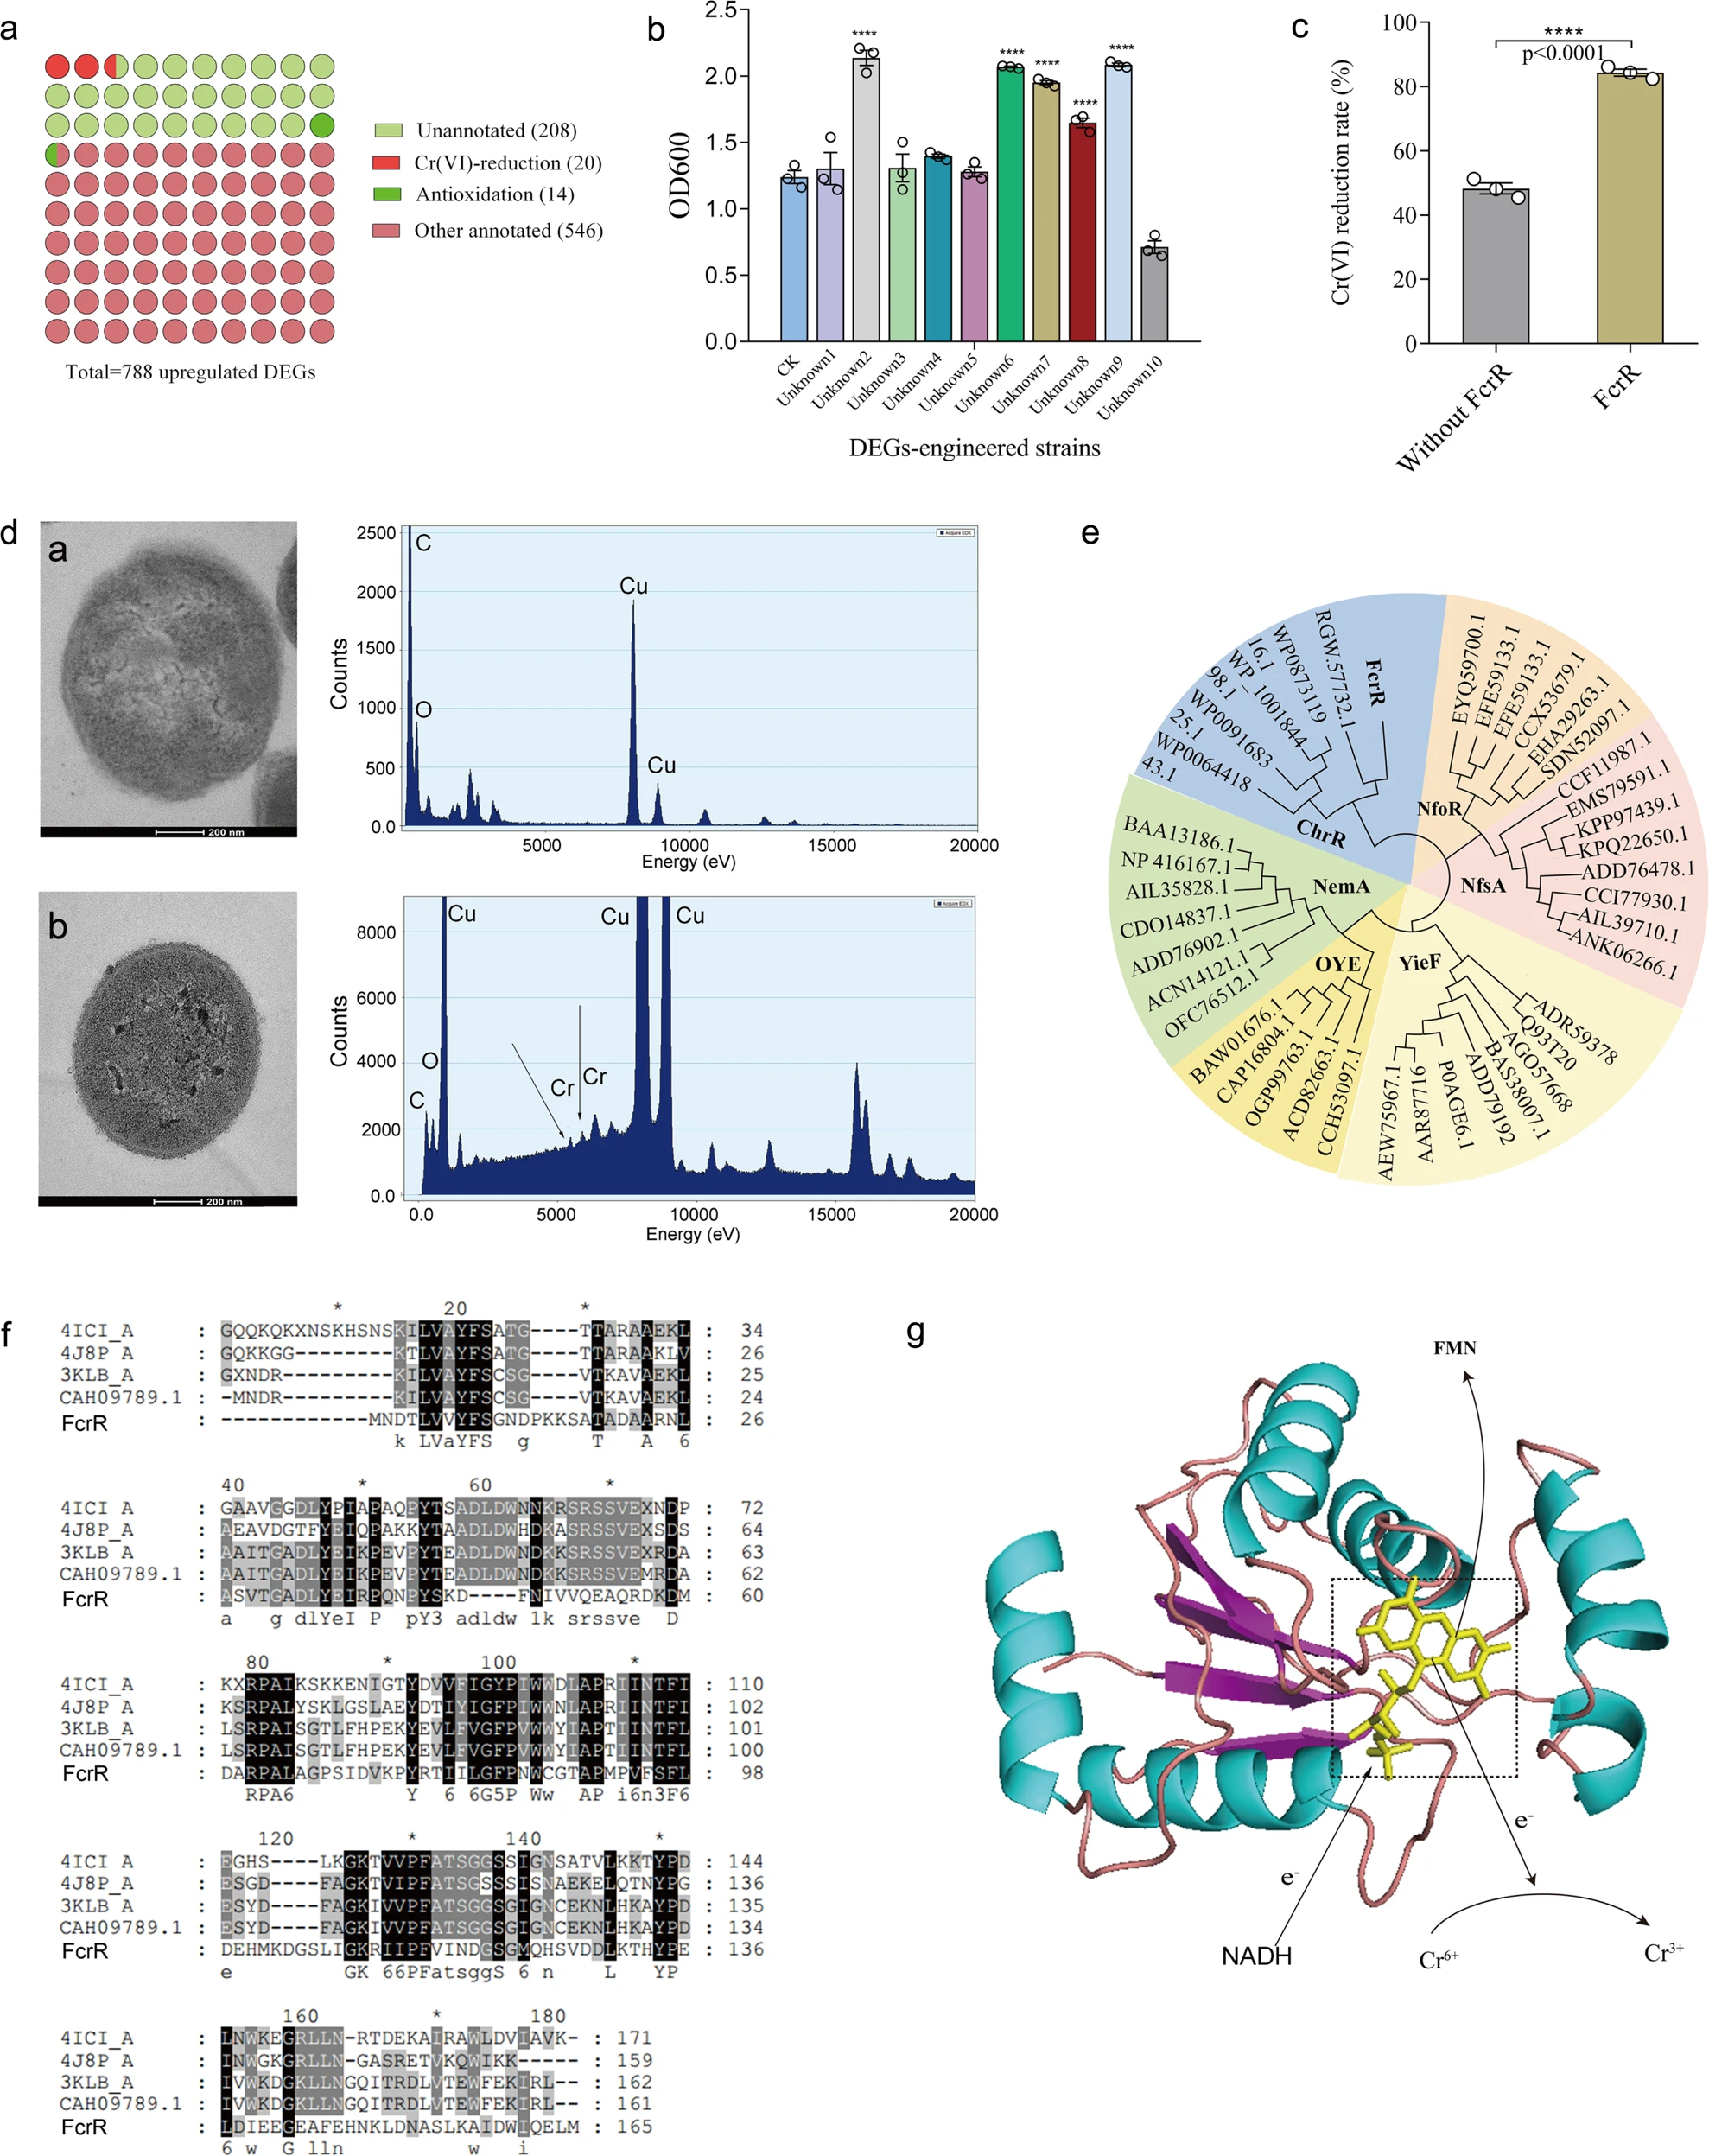
Heavy metal contamination in food endangers human health. Probiotics can protect animals and human against heavy metals, but the detoxification mechanism has not been fully clarified. Here, mice were supplemented with Pediococcus acidilactici strain BT36 isolated from Tibetan plateau yogurt, with strong antioxidant activity but no chromate reduction ability for 20 days to ensure gut colonization. Strain BT36 decreased chromate accumulation, reduced oxidative stress, and attenuated histological damage in the liver of mice. 16S rRNA and metatranscriptome sequencing analysis of fecal microbiota showed that BT36 reversed Cr(VI)-induced changes in gut microbial composition and metabolic activity. Specifically, BT36 recovered the expressions of 788 genes, including 34 inherent Cr remediation-relevant genes. Functional analysis of 10 unannotated genes regulated by BT36 suggested the existence of a new Cr(VI)-reduction gene in the gut microbiota. Thus, BT36 can modulate the gut microbiota in response to Cr(VI) induced oxidative stress and protect against Cr toxicity.
Figure 3.1.1 a The ratio of Firmicutes and Bacteroidetes. For 16S rRNA analysis, statistical analyses were conducted using the one-way ANOVA followed by Tukey’s post hoc test (n = 3). b Relative abundance (% of total reads) of bacterial 16S rRNA gene at the family level (n = 3). c Heatmap of the genus based on 16S rRNA sequencing (n = 3). The color of each rectangle in the heatmap reprensents the normalized and log-transformed relative abundance of each genus in four groups by a gradient of color from blue (low abundance, −1.5) to red (high abundance, 1.5). d Alterations in genus with statistically significant differences based on 16S rRNA sequencing (n = 3). The box- plots show the maximum, minimum and median, and the whisker indicates total range. e Taxonomic assignment of mRNA in each sample at the genus level. By default, all species whose expression abundance was less than 1% in all samples were combined with others. For d, STAMP v2.0.0 software (p < 0.05) was employed to analyze statistical significance between the fecal microbiome of four groups using ANOVA with Benjamini-Hochberg FDR multiple test correction, and to analyze statistical significance between the fecal microbiome of two groups using one sided t-test.
Figure 3.1.2 a The distribution of Cr remediation relevant genes in total DEGs. b The growth of engineered E. coli strains harboring DEGs in LB medium with 1 mM Cr(VI) (n = 3). CK represents E. coli BL21 containing the empty plasmid pET28a (+), unknown 1–10 represents E. coli BL21 with pET28a harboring gene comp53346, 53095, 24337, 53087, 53032, 51796, 52516, 53047, 53431, and 53299, respectively. c Cr(VI) reduction rate of engineered E. coli BL21 with 53431 (n = 3). d TEM and EDX analyses of E. coli FcrR after inoculated in LB medium and incubated overnight without Cr(VI) or with 1 mM Cr(VI), and the corresponding EDX spectra. Arrows show intracellular Cr(III) precipitates, and scale bars: 200 nm. e Evolutionary relationship of FcrR with known chromate reductases from different genera. A composite evolutionary tree with the FcrR was generated using the Neighbor-Joining method based on the reported chromate reductase families (NfoR, NfsA, YieF, OYE, NemA, and ChrR). f Sequence analysis of FcrR homologs. The highly conserved residues are highlighted in black, and other residues with high levels of similarity are highlighted in gray. g Structural modeling of FcrR. For b, data significance was analyzed using the one-way ANOVA followed by Tukey’s post hoc test. For c, data significance was analyzed using student’s t-test. Significance was marked as *p < 0.05, **p < 0.01, ***p < 0.001, and ****p < 0.0001.
4. References
[1] Feng, P., Ye, Z., Han, H. et al. Tibet plateau probiotic mitigates chromate toxicity in mice by alleviating oxidative stress in gut microbiota. Commun Biol 3, 242 (2020).
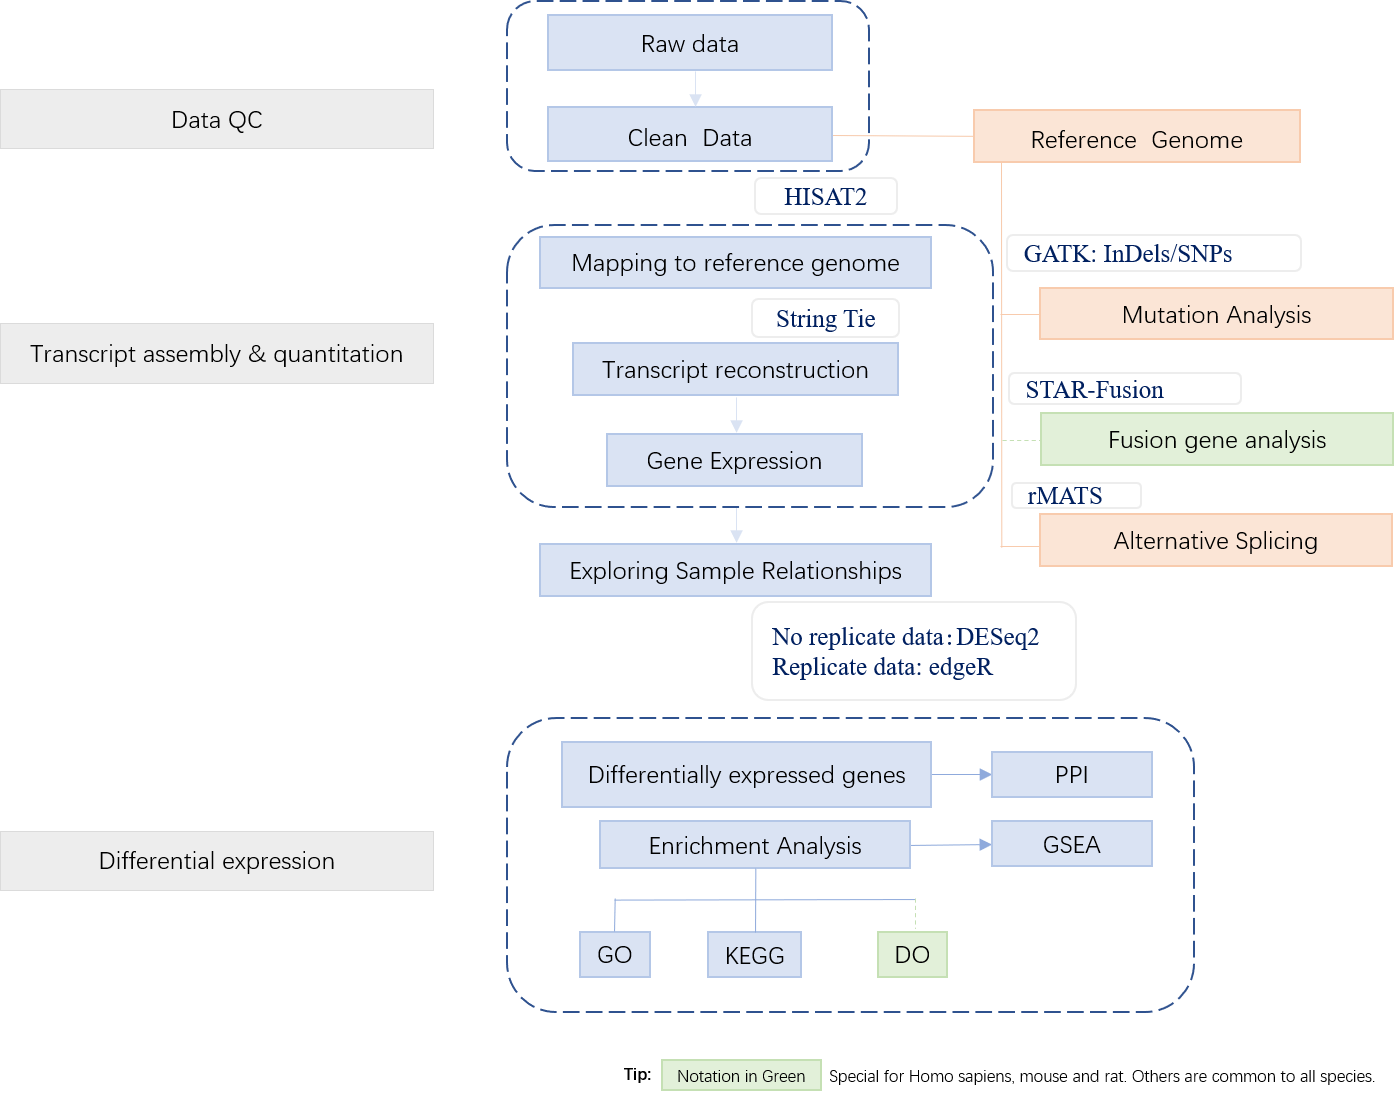
Transcriptomics
Transcriptomics is the study of the transcriptome—the complete set of RNA transcripts that are produced by the genome, under specific circumstances or in a specific cell—using high-throughput methods, such as next generation sequencing data analysis. Comparison of transcriptomes allows the identification of genes that are differentially expressed in distinct cell populations, or in response to different treatments.
Whole Transcriptome Sequencing
Transcriptome Sequencing
1. Overview
Transcriptome sequencing is a high-throughput sequencing of the total RNA produced by a certain species or a specific cell in a certain functional state, but now we mainly use it to detect mRNA.
APExBIO’s services not only detect differences in gene expression levels, but also provide structural analysis. Our work is to help you discover unknown transcripts and rare transcripts, and accurately identify differentially variable splicing sites, gene fusions, SNPs and InDel mutations, etc. The results can be applied to research on growth and development regulation mechanism and pathogenesis of major human diseases.
2. Workflow
Data Preparation
Normally, more than 90% of RNA is rRNA in the sample, so it is necessary to enrich the mRNA after extracting the total RNA. After that, synthesize cDNA by mRNA reverse transcription to construct a library. Then, sequencing the purified cDNA library. The figure below shows the basic steps of the pipeline:
Bioinformatics Analysis
3. Applications
3.1 Metabolome and Transcriptome Sequencing Analysis Reveals Anthocyanin Metabolism in Pink Flowers of Anthocyanin-Rich Tea (Camellia sinensis)
Abstract
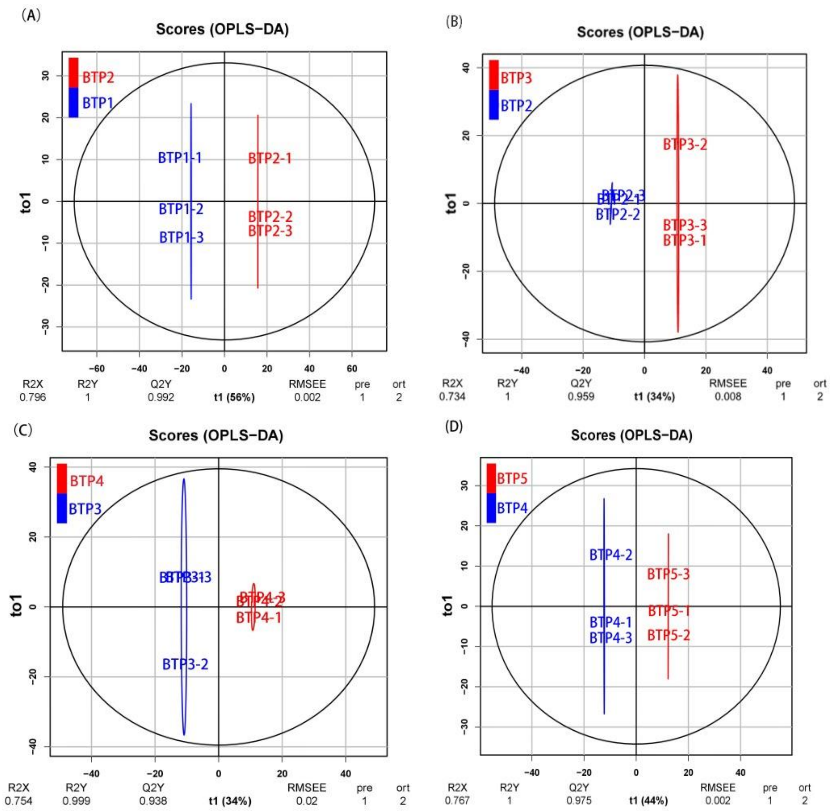
Almost all flowers of the tea plant (Camellia sinensis) are white, which has caused few researchers to pay attention to anthocyanin accumulation and color changing in tea flowers. A new purple-leaf cultivar, Baitang purple tea (BTP) was discovered in the Baitang Mountains of Guangdong, whose flowers are naturally pink, and can provide an opportunity to understand anthocyanin metabolic networks and flower color development in tea flowers. In the present study, twelve anthocyanin components were identified in the pink tea flowers, namely cyanidin O-syringic acid, petunidin 3-O-glucoside, pelargonidin 3-O-beta-d-glucoside, which marks the first time these compounds have been found in the tea flowers. The presence of these anthocyanins seem most likely to be the reason for the pink coloration of the flowers. Twenty-one differentially expressed genes (DEGs) involved in anthocyanin pathway were identified using KEGG pathway functional enrichment, and ten of these DEG’s screened using venn and KEGG functional enrichment analysis during five subsequent stages of flower development. By comparing DEGs and their expression levels across multiple flower development stages, we found that anthocyanin biosynthesis and accumulation in BTP flowers mainly occurred between the third and fourth stages (BTP3 to BTP4). Particularly, during the period of peak anthocyanin synthesis 17 structural genes were upregulated, and four structural genes were downregulated only. Ultimately, eight critical genes were identified using weighted gene co-expression network analysis (WGCNA), which were found to have direct impact on biosynthesis and accumulation of three flavonoid compounds, namely cyanidin 3-O-glucoside, petunidin 3-O-glucoside and epicatechin gallate. These results provide useful information about the molecular mechanisms of coloration in rare pink tea flower of anthocyanin-rich tea, enriching the gene resource and guiding further research on anthocyanin accumulation in purple tea.
Figure 3.1.1 The OPLS-DA results indicated that the main biological components were significantly changed along with changing stages of development. Figure 3.1.1 is an OPLS-DA plot showing the significance of change in metabolic profile moving from one development stage to the next. Figure 3.1.1 shows the composition between the first stage and second stage (BTP1 vs. BTP2), second stage and third stage (BTP2 vs. BTP3), third stage and fourth stage (BTP3 vs. BTP4) and fourth stage and fifth stage (BTP4 vs. BTP5) respectively clustered together in the OPLS score plots. The R2Y of this OPLS-DA model was 1.0, 1.0, 0.999 and 1.0 in metabolomic differences of different floral development, respectively. While, the Q2Y of the model was 0.992, 0.959, 0.938 and 0.975 (from BTP1 to BTP5), respectively. These data demonstrate highly significant differences in metabolite profiles based on development stage.
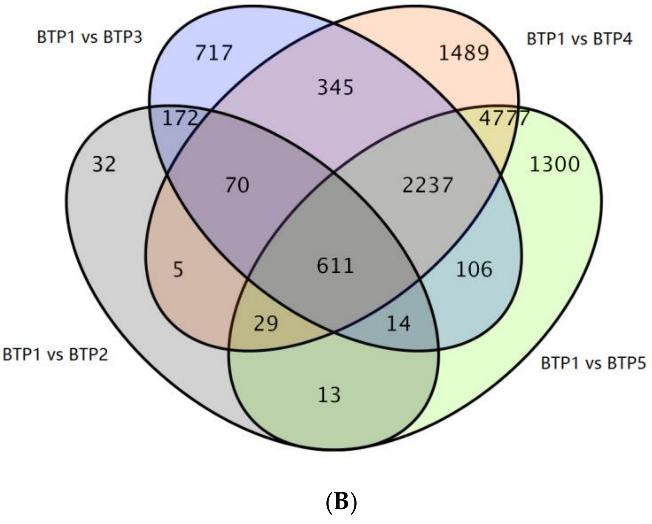
Figure 3.1.2 Venn Diagram of DEGs between 4 groups
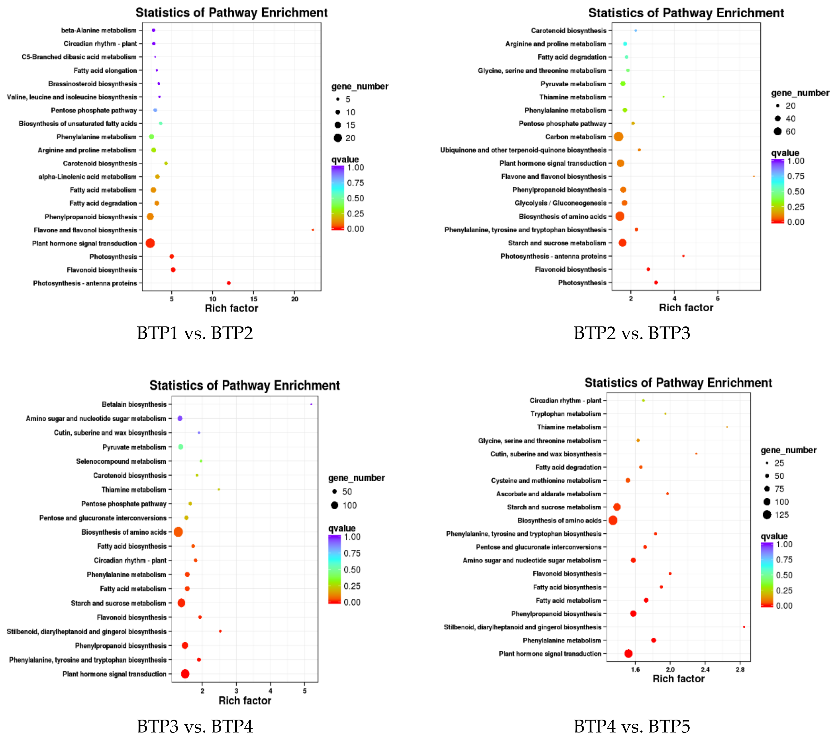
Figure 3.1.3 KEGG enrichment analysis of DEGs in different tea development stages.
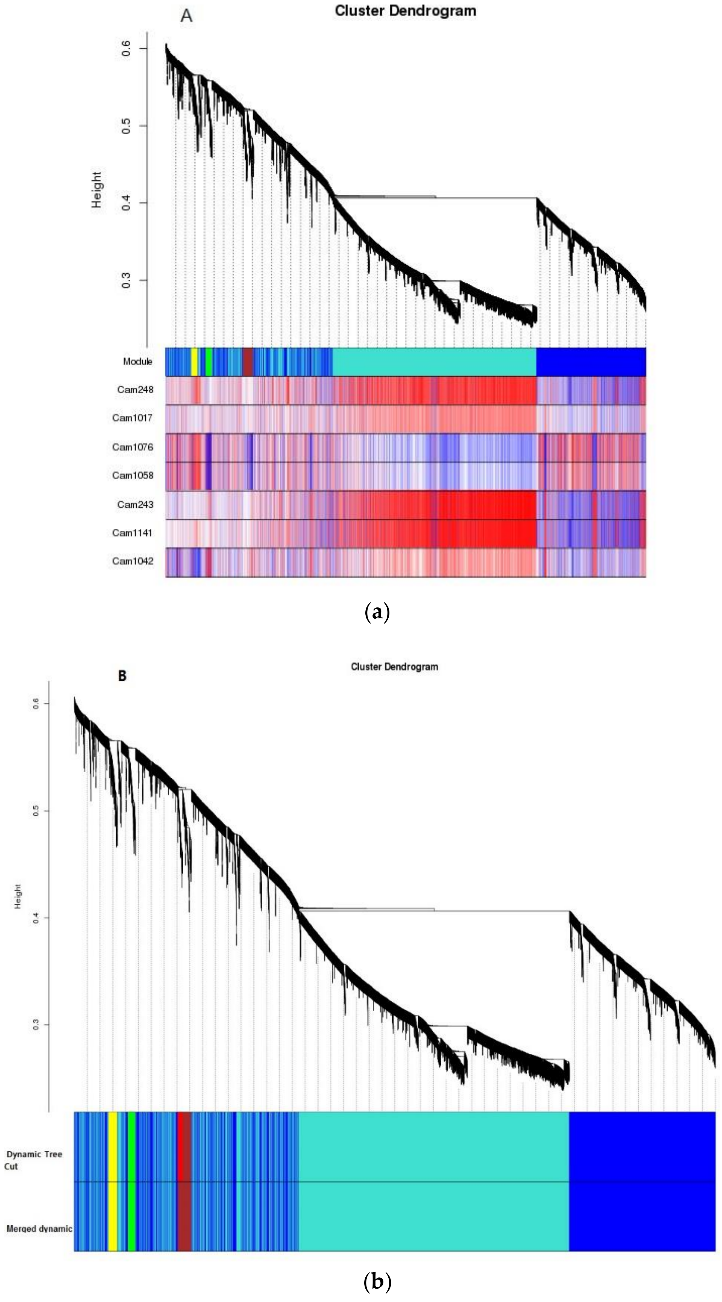
Figure 3.1.4 To reveal the gene expression levels involved in anthocyanins and flavonoid metabolism pathways, modules associated with anthocyanins were obtained by WGCNA. A module can be thought of as a cluster of closely interconnected genes. The interconnectedness of two genes is a combination of adjacency between them, and the strength of connections they share with other “third party” genes. This measure of proximity used by WGCNA is known as topological overlap measure (TOM). Using TOM, WGCNA clusters data into the type of dendrogram “tree” pictured in Figure 8A, B. Individual branches of the tree represent clusters of interconnected genes, which are then defined as “modules.” Each module is measured for co-expression with the trait phenotype, in this case flavonoids, in order to see what cluster of common genes is co-expressed with flavonoids in BTP flowers
3.2 Cardiac and Skeletal Muscle Transcriptome Response to Heat Stress in Kenyan Chicken Ecotypes Adapted to Low and High Altitudes Reveal Differences in Thermal Tolerance and Stress Response
Abstract
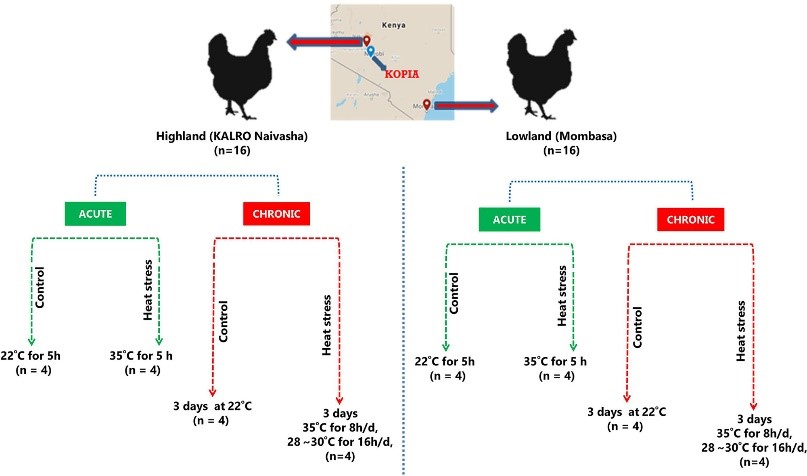
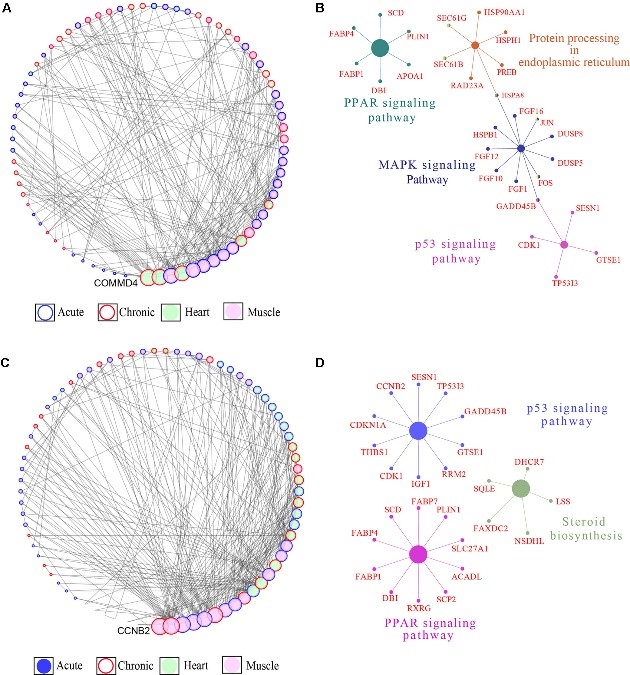
Heat stress (HS) negatively affects chicken performance. Agricultural expansion will happen in regions that experience high ambient temperatures, where fast-growing commercial chickens are vulnerable. Indigenous chickens of such regions, due to generations of exposure to environmental challenges, might have higher thermal tolerance. In this study, two indigenous chicken ecotypes, from the hot and humid Mombasa (lowland) and the colder Naivasha (highland) regions, were used to investigate the effects of acute (5 h, 35°C) and chronic (3 days of 35°C for 8 h/day) HS on the cardiac and skeletal muscle, through RNA sequencing. The rectal temperature gain and the number of differentially expressed genes (DEGs) [False Discovery Rate (FDR) < 0.05] were two times higher in the acute stage than in the chronic stage in both ecotypes, suggesting that cyclic exposure to HS can lead to adaptation. A tissue- and stage-specific difference in response to HS was observed, with peroxisome proliferator-activated-receptor (PPAR) signaling and mitogen-activate protein kinase (MAPK) signaling pathways, enriched in heart and skeletal muscle, respectively, and the p53 pathway enriched only in the acute stage in both tissues. The acute and chronic stage DEGs were integrated by a region-specific gene coexpression network (GCN), and genes with the highest number of connections (hub genes) were identified. The hub genes in the lowland network were CCNB2, Crb2, CHST9, SESN1, and NR4A3, while COMMD4, TTC32, H1F0, ACYP1, and RPS28 were the hub genes in the highland network. Pathway analysis of genes in the GCN showed that p53 and PPAR signaling pathways were enriched in both low and highland networks, while MAPK signaling and protein processing in endoplasmic reticulum were enriched only in the gene network of highland chickens. This shows that to dissipate the accumulated heat, to reduce heat induced apoptosis, and to promote DNA damage repair, the ecotypes activated or suppressed different genes, indicating the differences in thermal tolerance and HS response mechanisms between the ecotypes. This study provides information on the HS response of chickens, adapted to two different agro climatic environments, extending our understanding of the mechanisms of HS response and the effect of adaptation in counteracting HS.
Figure 3.2.1 Schematic experimental design.
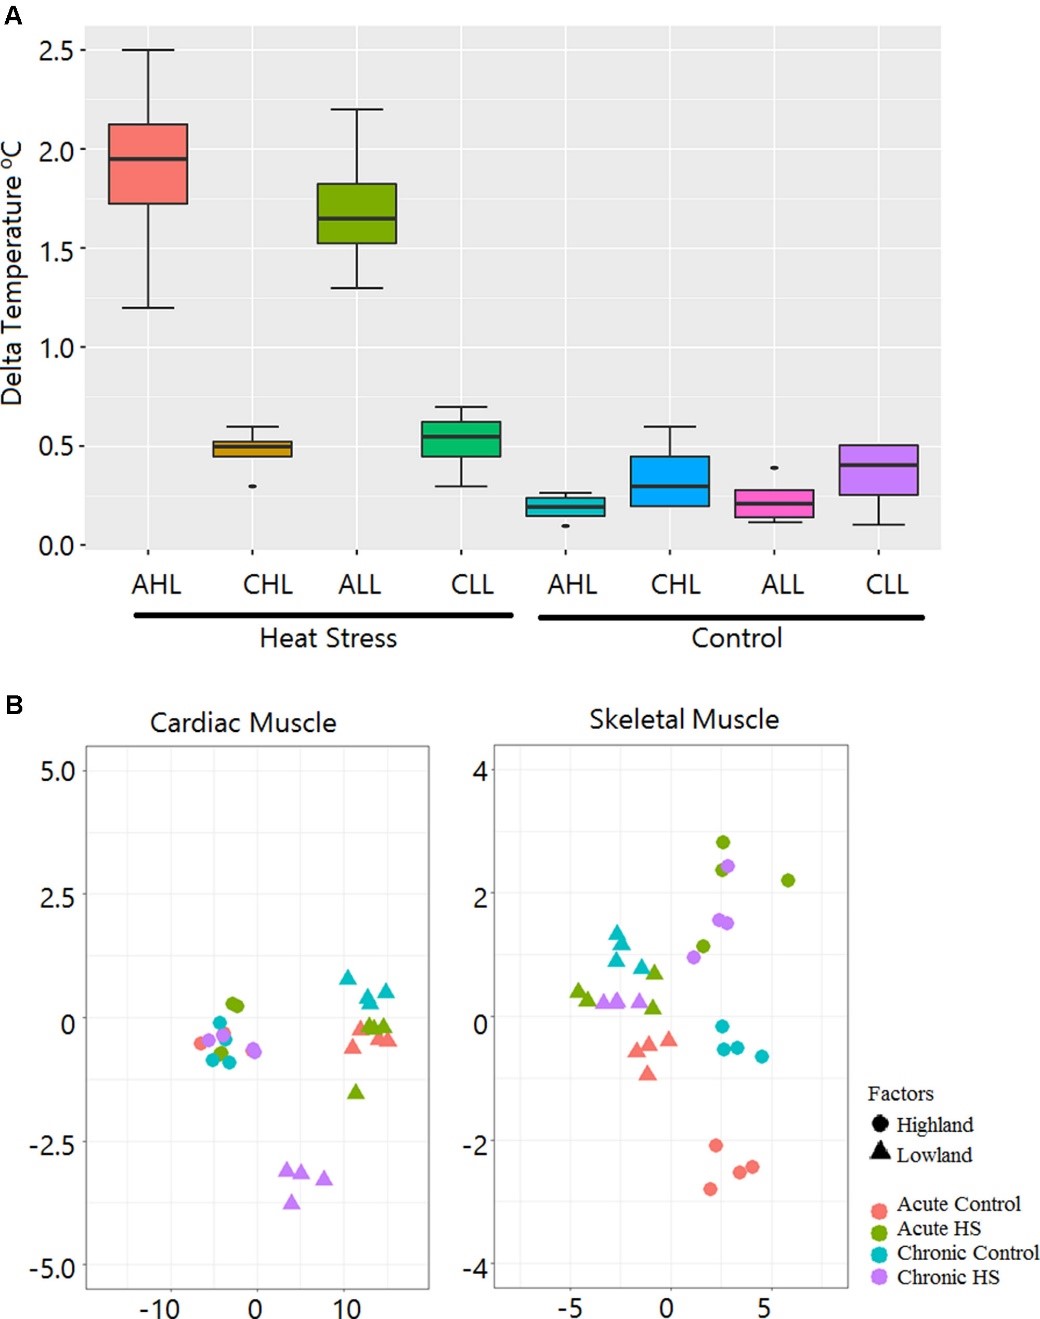
Figure 3.2.2 Rectal temperature gain during HS treatment and sample relationship inferred from principal components analysis. (A) Box plot showing gain in rectal temperature due to HS treatment. AHL, acute highland; CHL, chronic highland; ALL, acute lowland; CLL, chronic lowland. (B) Principal components analysis showing that the maximum variation is due to differences between the ecotypes. Only a small percentage of the variation is due to the HS effect.
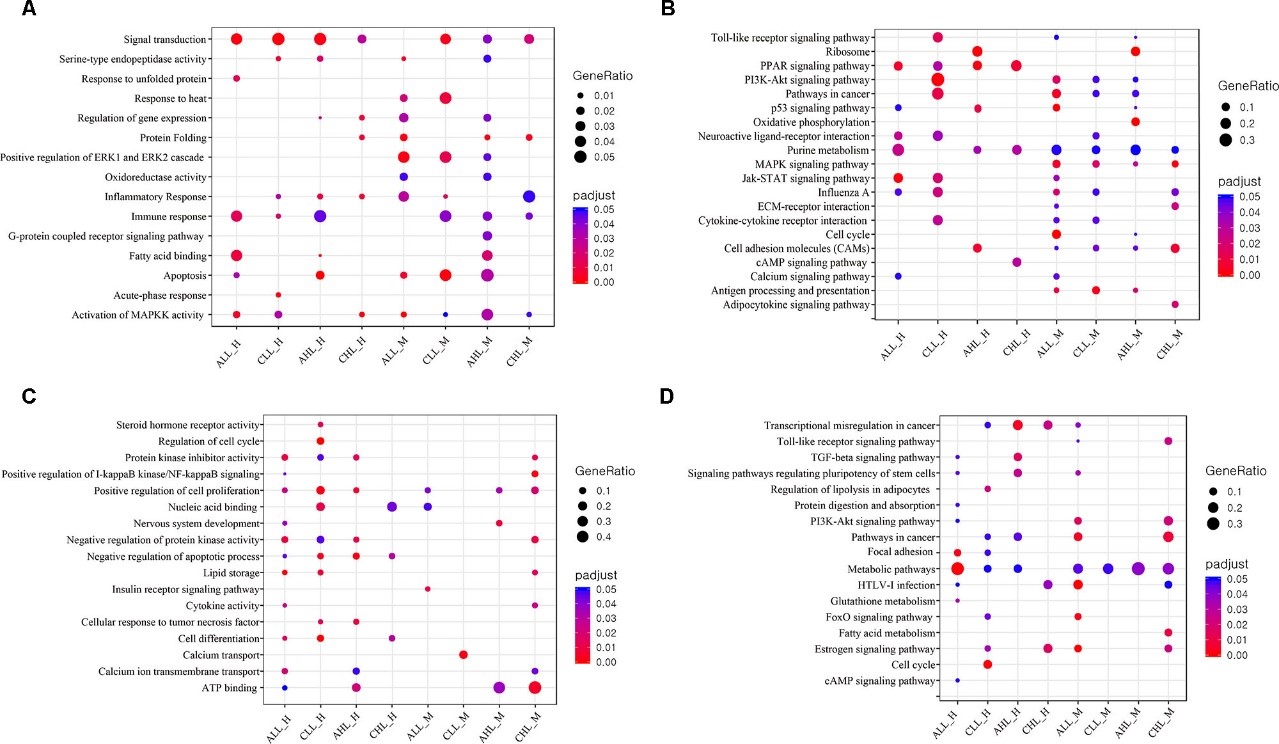
Figure 3.2.3 GO and KEGG pathway enrichment analysis (A) Dot plot shows the up-regulated GO terms (FDR
Figure 3.2.4 Gene coexpression network (GCN) and pathway enrichment analysis integrated for the skeletal and cardiac muscle DEGs. (A) Degree sorted network of DEGs in at least one contrast in the highland chickens. The nodes are genes, and the edges are based on correlation coefficients. Only genes with a partial correlation | r | of ≥0.99 were included in network. Node color denotes the tissue type in which the gene expression was the highest, while node border denotes the stage at which the gene expression was the highest. (B) KEGG pathway networks in which all the genes in the highland GCN network were enriched. (C) Degree sorted network of DEG in at least one contrast in the lowland chickens. The nodes are genes, and the edges are based on correlation coefficients. Only genes with a partial correlation | r | of ≥0.99 were included in network. Node color denotes the tissue type in which the gene expression was the highest, while node border denotes the stage at which the gene expression was the highest. (D) KEGG pathway networks in which all the genes in the lowland GCN network were enriched.
4. References
[1] Zhu, K. P., Zhang, C. L., Ma, X. L., Hu, J. P., Cai, T., & Zhang, L. (2019). Analyzing the interactions of mRNAs and ncRNAs to predict competing endogenous RNA networks in osteosarcoma chemo-resistance. Molecular Therapy, 27(3), 518-530. doi: 10.1016/j.ymthe.2019.01.001
[2] Srikanth K, Kumar H, Park W, et al. Cardiac and Skeletal Muscle Transcriptome Response to Heat Stress in Kenyan Chicken Ecotypes Adapted to Low and High Altitudes Reveal Differences in Thermal Tolerance and Stress Response. Front Genet. 2020;11:197. doi:10.3389/fgene.2019.00993
Small RNA Sequencing
Circular RNA Sequencing
Long non-coding RNA Sequencing
Single Cell RNA Sequencing
Genomics
APExBIO’s whole genome sequencing (WGS) detects the complete genome sequence at one time and provides the most comprehensive collection of an individual’s genetic variation based on the reference genome, and analyzes the differences of individuals or groups. By this way, we can obtain a lot of genome information, such as SNP, InDel, LOH, CNV and SV.
WGS can be applied to genetics and evolution studies to detect genome-wide genetic variations, pathogenic and susceptibility genes, and to enable genetic diversity and evolution analysis. It can also be applied to translational research to provide information on cancer and disease-associated mutations and is one of the most important approaches of precision medicine.
Whole Genome Sequencing
Epigenomics
Epigenomics is the study of the complete set of epigenetic modifications on the genetic material of a cell, known as the epigenome. The field is analogous to genomics and proteomics, which are the study of the genome and proteome of a cell.
KAS-Seq
MeRIP-Seq
ATAC-Seq
1. Overview
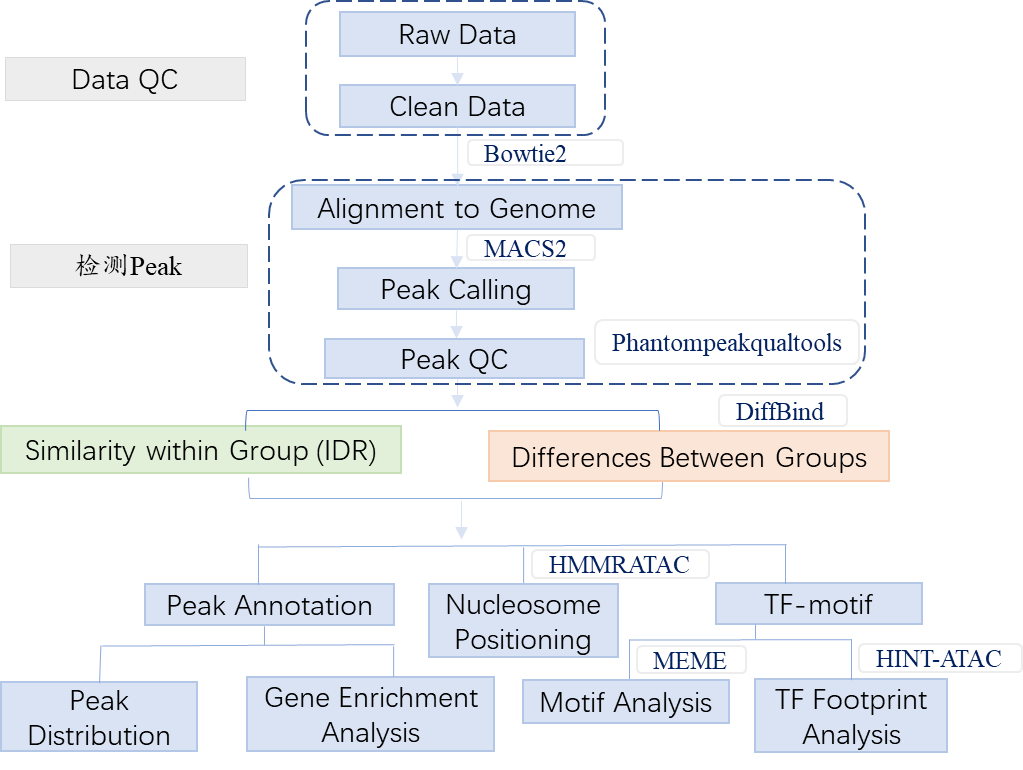
Assay for Transposase-Accessible Chromatin sequencing (ATAC-seq) employs Tn5, a transposase which can easily bind to the open chromatin, and sequencing the DNA captured by the enzyme. This technique has been used to identify open chromatin with a higher signal-to-noise ratio and lower input requirements than other approaches. APExBIO offers the entire ATAC-seq workflow, from library preparation to data analysis. Our services can provide information about all open sequences in the genome, we also help you analyze regulatory elements and find transcription factor binding sites.
2. Workflow
3. Applications
3.1 ATAC-seq reveals alterations in open chromatin in pancreatic islets from subjects with type 2 diabetes
Abstract
Impaired insulin secretion from pancreatic islets is a hallmark of type 2 diabetes (T2D). Altered chromatin structure may contribute to the disease. We therefore studied the impact of T2D on open chromatin in human pancreatic islets. We used assay for transposase-accessible chromatin using sequencing (ATAC-seq) to profile open chromatin in islets from T2D and non-diabetic donors. We identified 57,105 and 53,284 ATAC-seq peaks representing open chromatin regions in islets of non-diabetic and diabetic donors, respectively. The majority of ATAC-seq peaks mapped near transcription start sites. Additionally, peaks were enriched in enhancer regions and in regions where islet-specific transcription factors (TFs), e.g. FOXA2, MAFB, NKX2.2, NKX6.1 and PDX1, bind. Islet ATAC-seq peaks overlap with 13 SNPs associated with T2D (e.g. rs7903146, rs2237897, rs757209, rs11708067 and rs878521 near TCF7L2, KCNQ1, HNF1B, ADCY5 and GCK, respectively) and with additional 67 SNPs in LD with known T2D SNPs (e.g. SNPs annotated to GIPR, KCNJ11, GLIS3, IGF2BP2, FTO and PPARG). There was enrichment of open chromatin regions near highly expressed genes in human islets. Moreover, 1,078 open chromatin peaks, annotated to 898 genes, differed in prevalence between diabetic and non-diabetic islet donors. Some of these peaks are annotated to candidate genes for T2D and islet dysfunction (e.g. HHEX, HMGA2, GLIS3, MTNR1B and PARK2) and some overlap with SNPs associated with T2D (e.g. rs3821943 near WFS1 and rs508419 near ANK1). Enhancer regions and motifs specific to key TFs including BACH2, FOXO1, FOXA2, NEUROD1, MAFA and PDX1 were enriched in differential islet ATAC-seq peaks of T2D versus non-diabetic donors. Our study provides new understanding into how T2D alters the chromatin landscape, and thereby accessibility for TFs and gene expression, in human pancreatic islets.
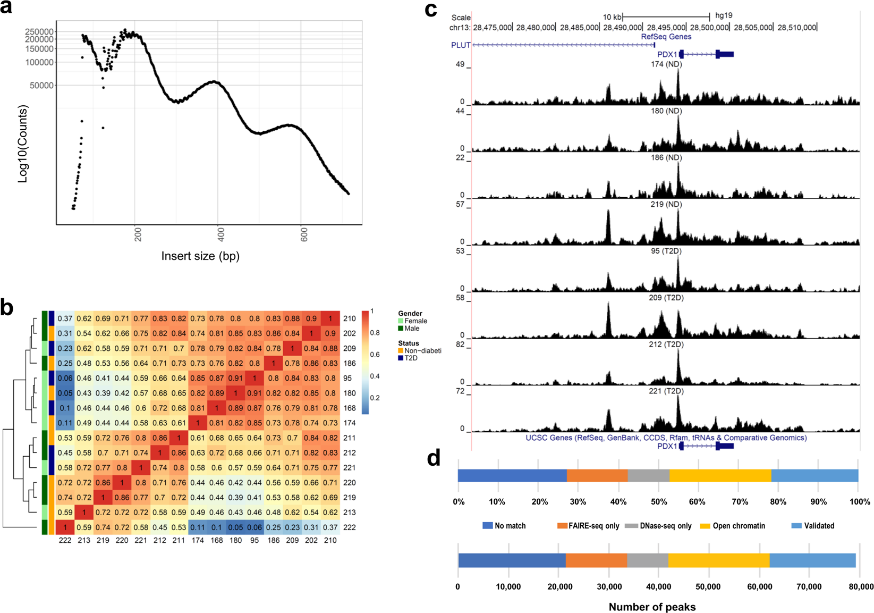
Figure 3.1.1 (a) Insert size distributions of islet ATAC-seq data showing clear nucleosome phasing. The first peak represents the open chromatin, peak 2 to 4 represent mono-, di- and tri-nucleosomal regions. (b) Hierarchical clustering of the Spearman correlation of the ATAC-seq data, as calculated by binning reads for consecutive bins of 10 kilobases including ATAC-seq data of all analyzed islet samples and excluding Y-chromosome data. (c) Representative sequencing tracks for the PDX1 locus show distinct ATAC-seq peaks at the promoter and the known enhancer in human islets. The ATAC-seq data have been normalized to take sequencing depth into account and the scale on the y-axis was chosen for optimal visualization of peaks for each sample. (d) Proportions of islet ATAC-seq peaks identified in at least three donors (79,255 open chromatin peaks) overlapping with ENCODE open chromatin data generated using FAIRE-seq and DNaseI-seq in human islets. ATAC-seq peaks overlap with the following number and categories of ENCODE peaks: 17,172 validated peaks, 20,178 open chromatin peaks, 8,288 DNaseOnly peaks and 12,063 FAIREonly peaks. 21,554 ATAC-seq peaks did not match with ENCODE peaks.
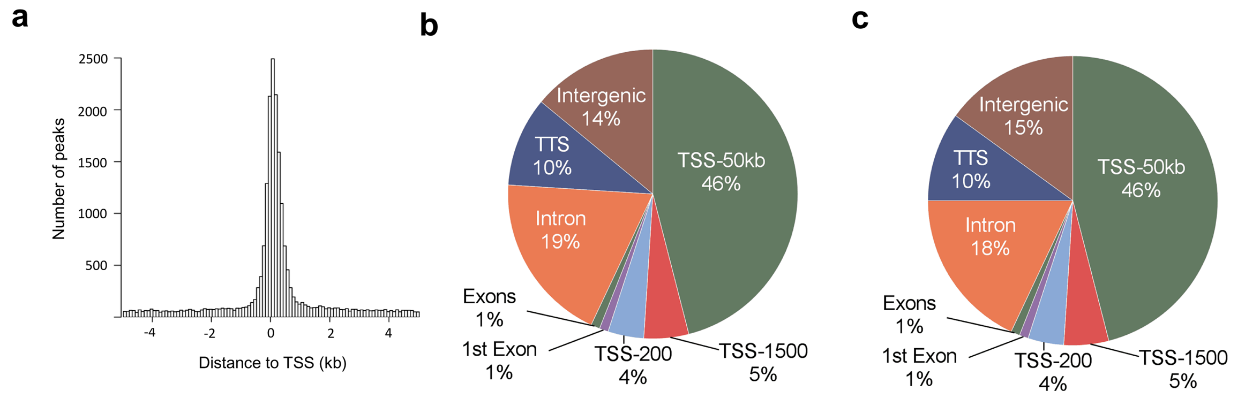
Figure 3.1.2 (a) Histogram showing the distance from the nearest transcription start site (TSS) for all islet ATAC-seq peaks. (b-c) Proportions of islet ATAC-seq peaks annotated to different genomic regions in (b) non-diabetic donors and (c) donors with type 2 diabetes. Here, TSS-50 kb represents 1,501–50,000 bp upstream of the TSS, TSS-1500 represents 201–1,500 bp upstream of the TSS, TSS-200 represents 1–200 bp upstream of the TSS, and TTS represents 1–10,000 bp downstream of the transcript termination site.
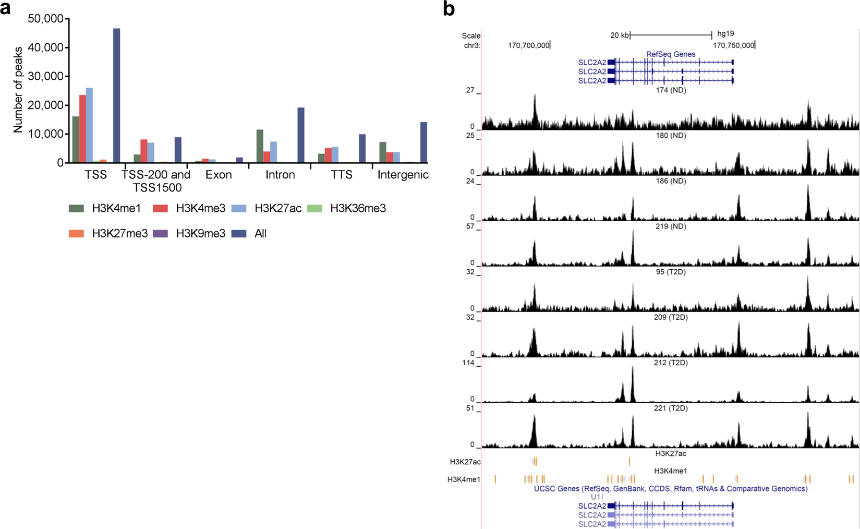
Figure 3.1.3 (a) Bar graph of overlapping islet ATAC-seq peaks in non-diabetic donors and different histone modifications. Based on chi-square tests and false discovery rate (FDR) analysis (q < 0.001, P < 9 × 10−153) more islet ATAC-seq peaks than expected overlapped with H3K4me1, H3K4me3, and H3K27ac and less peaks than expected overlapped with H3K27me3, H3K9me3 and H3K36me3. (b) Representative sequencing tracks for the SLC2A2 locus show ATAC-seq peaks that overlap with H3K4me1 and H3K27ac in human islets. The ATAC-seq data have been normalized to take sequencing depth into account and the scale on the y-axis was chosen for optimal visualization of peaks for each sample.
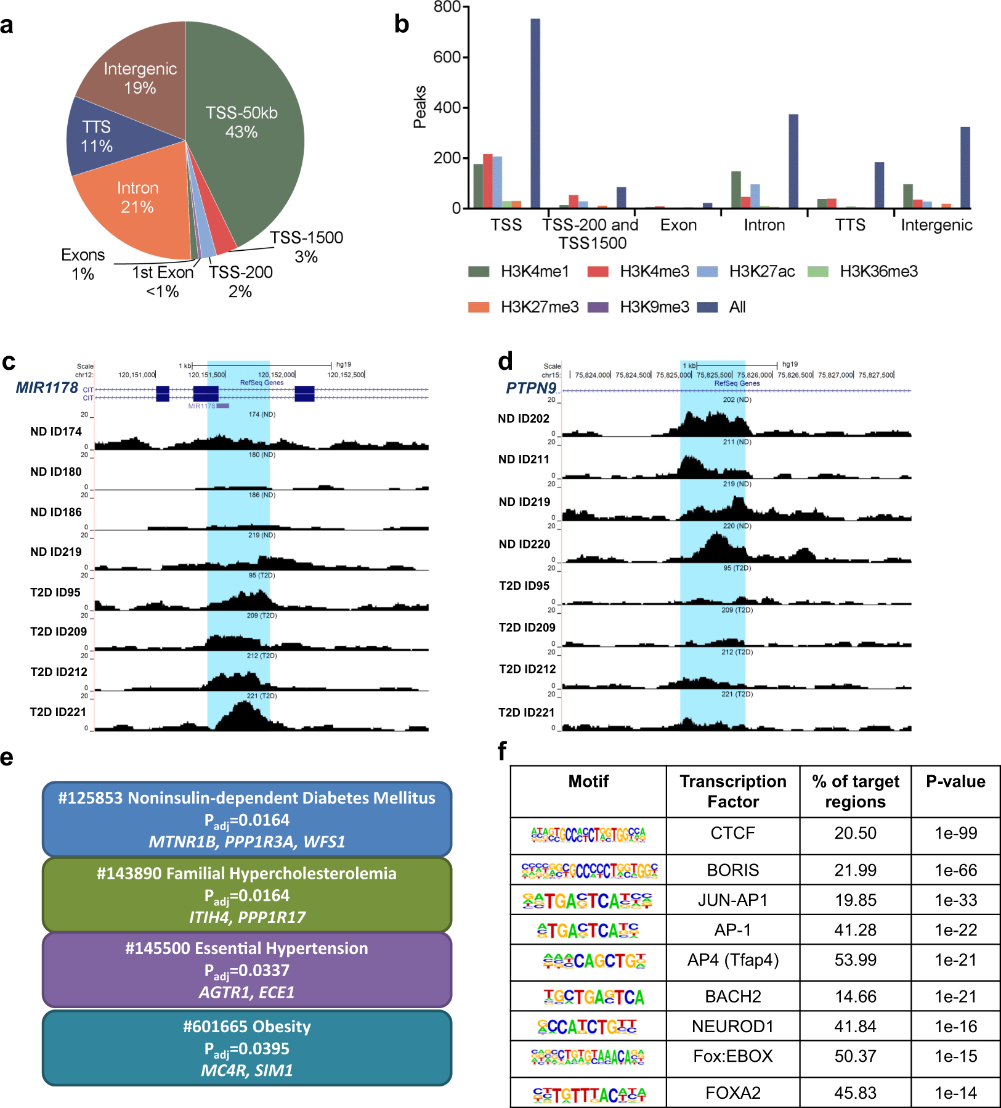
Figure 3.1.4 (a) Proportions of differential islet ATAC-seq peaks of type 2 diabetic versus non-diabetic donors annotated to different genomic regions. (b) Bar graph of differential islet ATAC-seq peaks of type 2 diabetic versus non-diabetic donors that overlap with histone modifications. (c-d) Sequencing tracks of ATAC-seq peaks that are more prevalent in donors with type 2 diabetes (annotated to MIR1178) (c) or non-diabetics (annotated to PTPN9) (d). The ATAC-seq data have been normalized to take sequencing depth into account. (e) Disease related pathways based on enrichment of genes annotated to differential islet ATAC-seq peaks of type 2 diabetic versus non-diabetic donors. The same pathways were significant when analyzing genes annotated to the 1,044 peaks enriched in T2D versus non-diabetic donors (Padj = 0.0159, Padj = 0.0175, Padj = 0.324 and Padj = 0.0425, respectively). Padj are adjusted by FDR. (f) Enrichment of transcription factor recognition sequences in differential islet ATAC-seq peaks of type 2 diabetic versus non-diabetic donors based on HOMER17.
3.2 Changes in chromatin accessibility between Arabidopsis stem cells and mesophyll cells illuminate cell type‐specific transcription factor networks
Abstract
Cell differentiation is driven by changes in the activity of transcription factors (TFs) and subsequent alterations in transcription. To study this process, differences in TF binding between cell types can be deduced by probing chromatin accessibility. We used cell type‐specific nuclear purification followed by the assay for transposase‐accessible chromatin (ATAC‐seq) to delineate differences in chromatin accessibility and TF regulatory networks between stem cells of the shoot apical meristem (SAM) and differentiated leaf mesophyll cells in Arabidopsis thaliana. Chromatin accessibility profiles of SAM stem cells and leaf mesophyll cells were very similar at a qualitative level, yet thousands of regions having quantitatively different chromatin accessibility were also identified. Analysis of the genomic regions preferentially accessible in each cell type identified hundreds of overrepresented TF‐binding motifs, highlighting sets of TFs that are probably important for each cell type. Within these sets, we found evidence for extensive co‐regulation of target genes by multiple TFs that are preferentially expressed in each cell type. Interestingly, the TFs within each of these cell type‐enriched sets also showed evidence of extensively co‐regulating each other. We further found that preferentially accessible chromatin regions in mesophyll cells tended to also be substantially accessible in the stem cells, whereas the converse was not true. This observation suggests that the generally higher accessibility of regulatory elements in stem cells might contribute to their developmental plasticity. This work demonstrates the utility of cell type‐specific chromatin accessibility profiling for the rapid development of testable models of regulatory control differences between cell types.
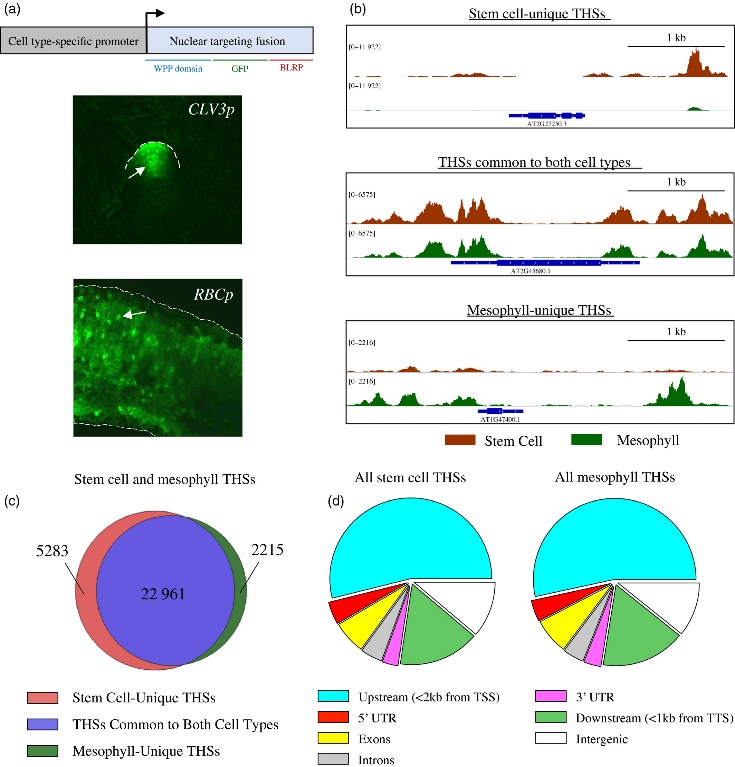
Figure 3.2.1 Characterization of INTACT (isolation of nuclei tagged in specific cell types) transgenic lines and overview of assay for transposase‐accessible chromatin (ATAC‐seq) data from each cell type. (a) The upper panel is a schematic representation of the INTACT system for isolating nuclei from specific cell types. The nuclear targeting fusion (NTF) contains a WPP nuclear envelope‐binding domain, green fluorescent protein (GFP) for visualization, and a biotin ligase recognition peptide (BLRP), which can be biotinylated by the BirA biotin ligase. BirA is expressed constitutively while the NTF is driven from a cell type‐specific promoter. When these transgenes are co‐expressed in a cell the nucleus becomes biotinylated, allowing all nuclei of that cell type to be selectively purified with streptavidin beads. Below the gene diagram are confocal images of GFP expression in the CLV3p:NTF;ACT2p:BirA line (upper) and RBCp:NTF;ACT2p:BirA line (lower), showing NTF expression in the shoot apical meristem and mesophyll cells, respectively. Fluorescent nuclei are labeled with arrowheads. (b) Three Integrated Genome Viewer (IGV) snapshots of normalized ATAC‐seq reads from shoot apical stem cell (red) and mesophyll (green) nuclei. Different categories of transposase hypersensitive sites (THSs) are observed. Top panel: stem cell‐unique – THSs identified only in stem cells. Middle panel: common to both cell types – THSs that were identified in both stem cells and mesophyll cells. Bottom panel: mesophyll‐unique – THSs that were identified only in mesophyll cells. (c) Overlap of stem cell and mesophyll ATAC‐seq THSs identified by peak calling in at least two biological replicates of that cell type. (d) Genomic distribution, generated using the software tool PAVIS, of all the THSs identified in two replicates for either stem cell or mesophyll ATAC‐seq.
Figure 3.2.2 Chromatin accessibility differences between stem cells and mesophyll cells.
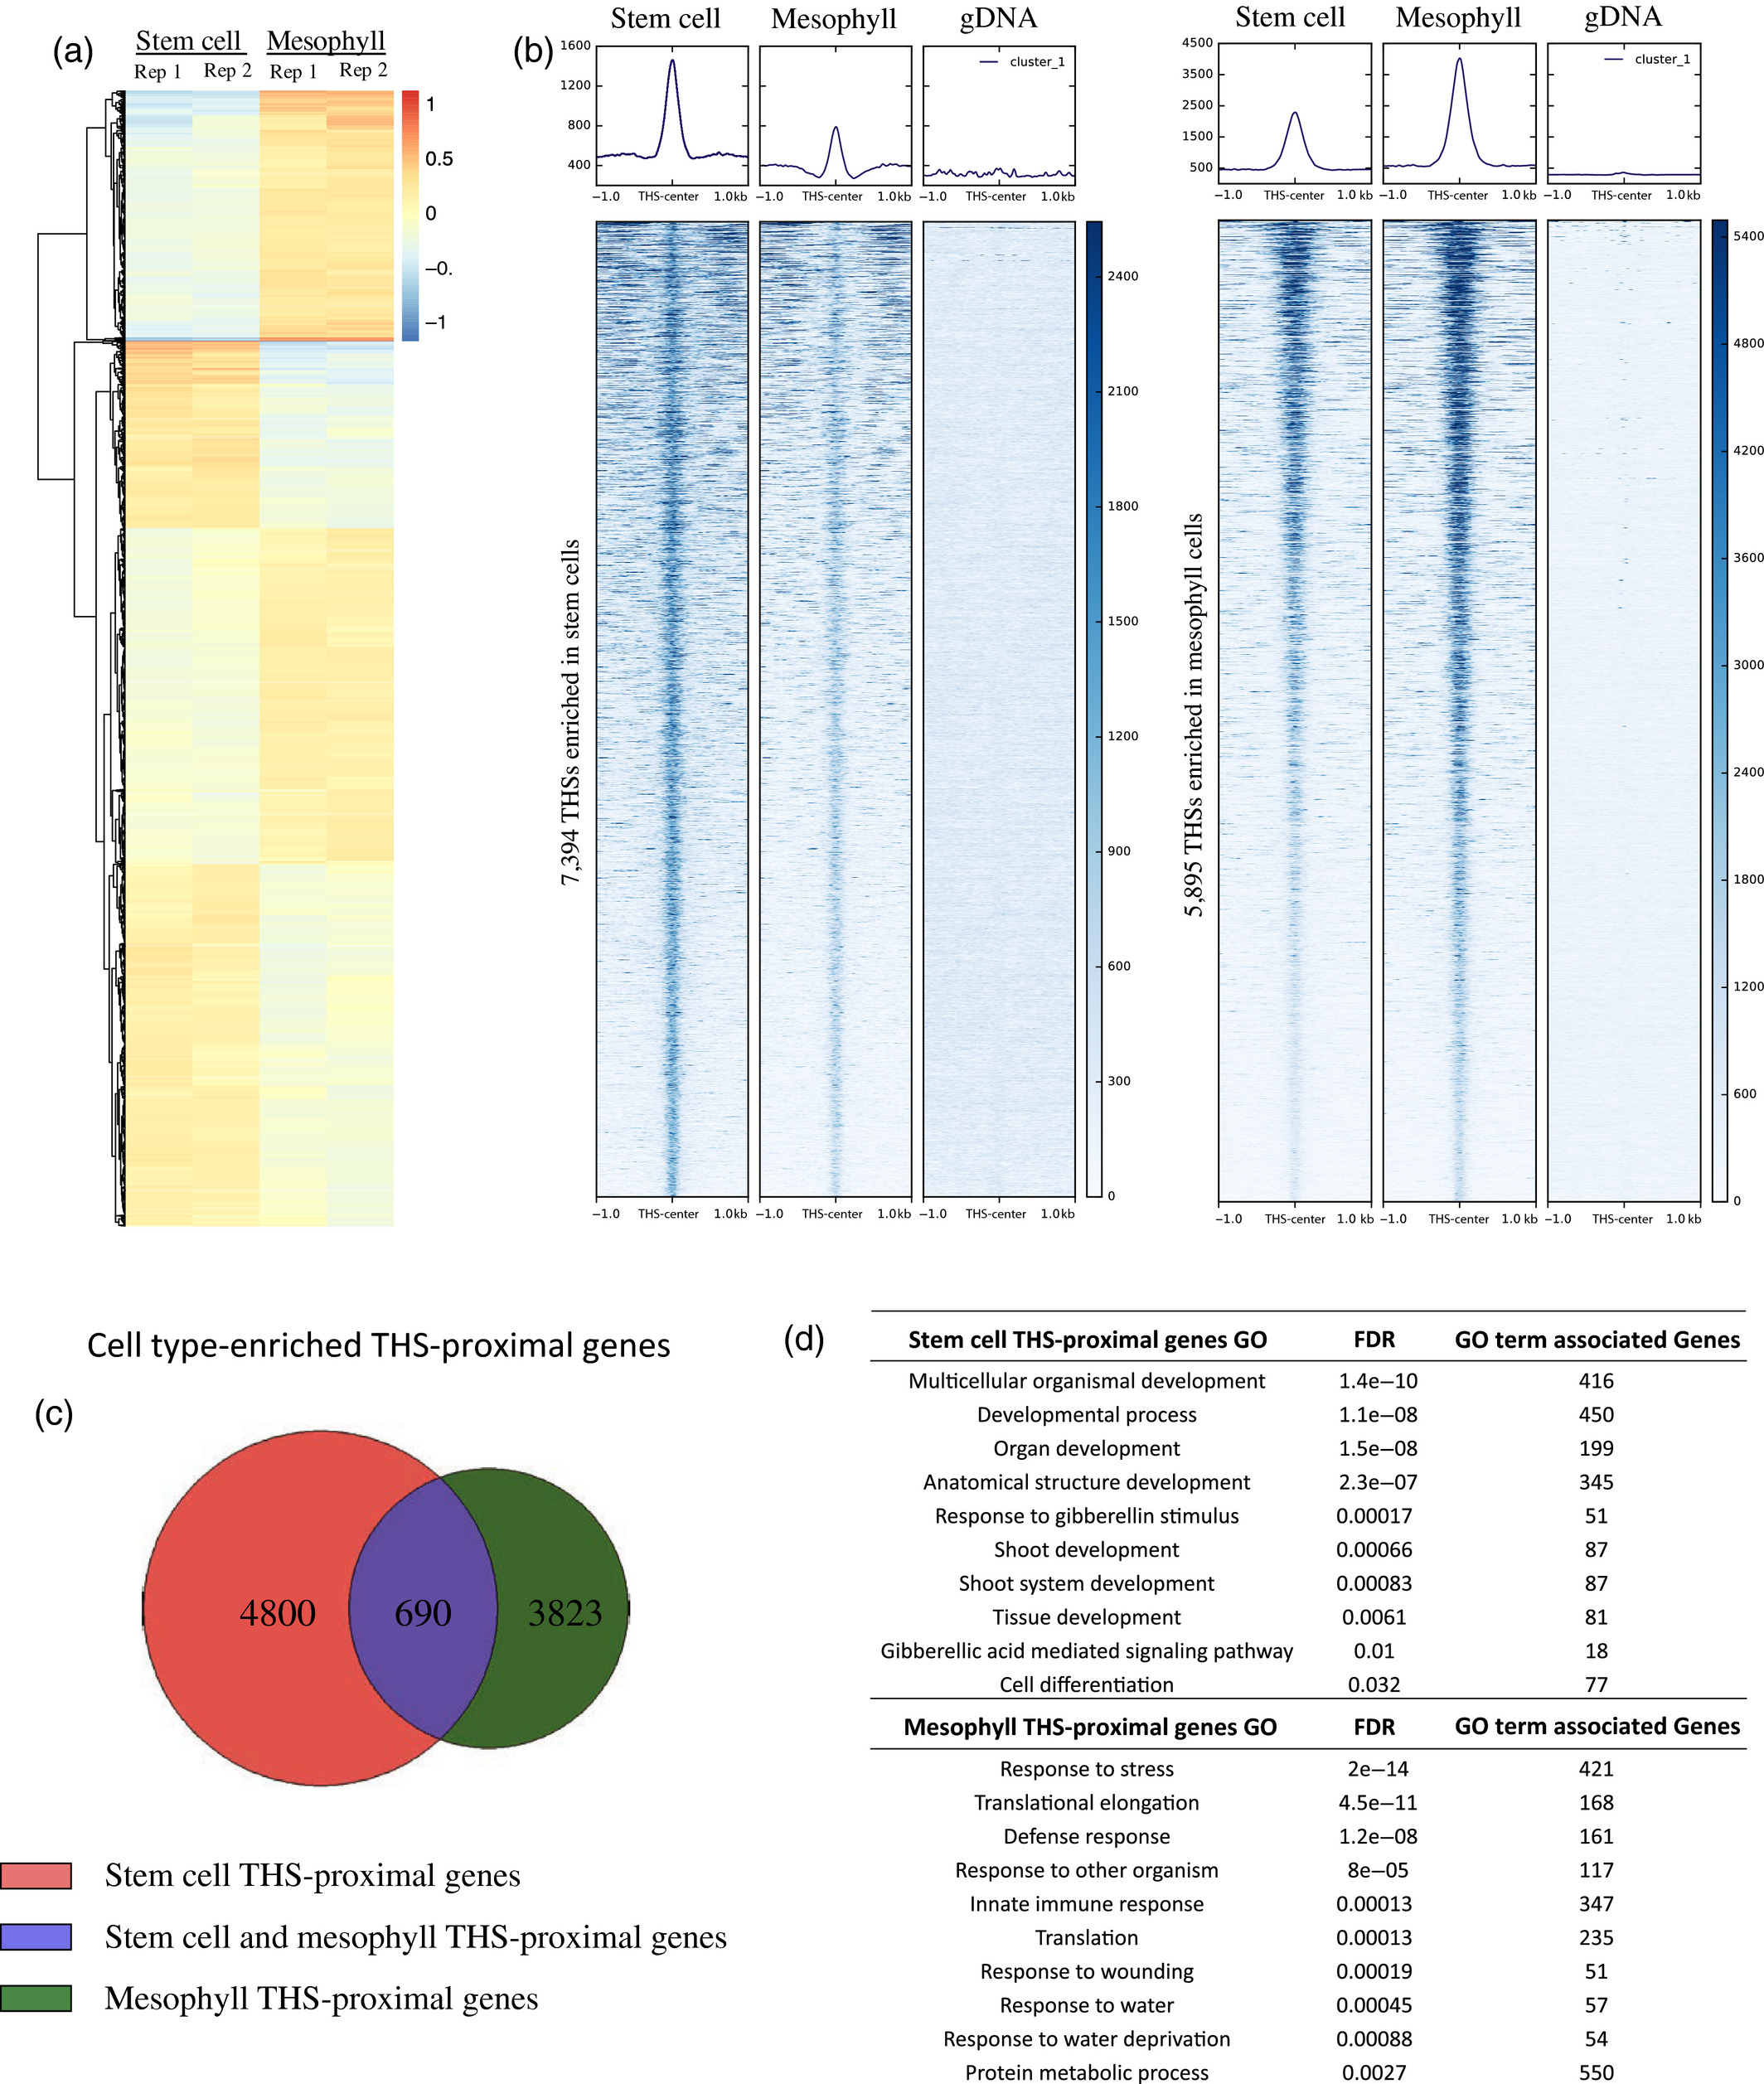
(a) Heatmap showing the log ratio of normalized read count of the top 13 289 transposase hypersensitive sites (THSs) that are statistically different between stem cell and mesophyll assay for transposase‐accessible chromatin (ATAC‐seq) samples. Each line on the heatmap represents a single THS, and the values at that region are given for each of two replicates in each cell type. Increased chromatin accessibility between the four samples is colored red and decreased chromatin accessibility is colored blue, compared with an average value set to 0.
(b) Normalized read signal in stem cell, mesophyll, and genomic DNA ATAC‐seq samples over cell type‐enriched THS regions. The left set of panels show ATAC‐seq signal over the 7394 stem cell‐enriched THSs, while the right set of panels show ATAC‐seq signal over the 5895 THSs enriched in mesophyll cells.
(c) Each cell type‐enriched THS was assigned to its nearest transcription start site as the putatively regulated target gene. The Venn diagram shows the overlap of cell type‐enriched THS‐proximal genes.
(d) Examples of 10 Gene Ontology (GO) terms that were found only among the lists of genes that have a nearby cell type‐enriched THS in a given cell type (i.e. from the non‐overlapping portions of the diagram in part (c)). FDR, false discovery rate.
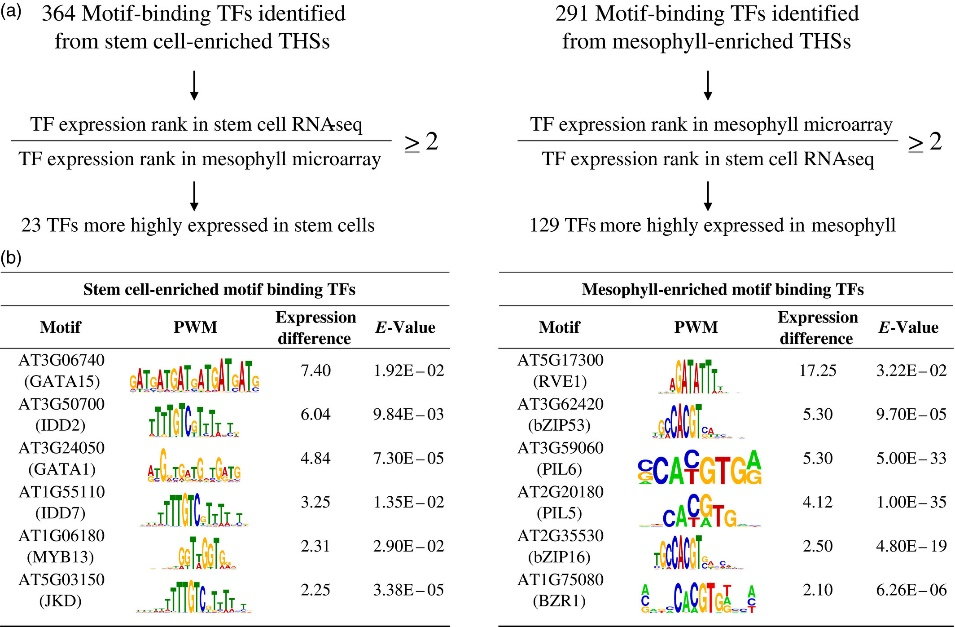
(a) Cell type‐enriched THS sequences were centered and scaled to 300 bp, repeat masked and analyzed with MEME‐ChIP. Motifs that had an E‐value equal to or less than 0.05 were considered significant. The 364 and 291 transcription factors (TFs) associated with overrepresented motifs from stem cell‐ and mesophyll‐enriched THSs, respectively, were further separated by their ranked expression difference between previously reported stem cell RNA‐seq and mesophyll microarray data. Only those TFs that had at least a two‐fold higher expression rank difference for the cell type in which their motif was identified were kept (Table S5).
(b) Six TFs that potentially regulate transcriptional networks for each cell type, their position weight matrix (PWM), expression rank difference between the two cell types and E‐value from the MEME‐ChIP analysis are shown for stem cells (left) and mesophyll (right). The TFs are ranked by their difference in expression rank between the two cell types, with the highest expression rank difference for the corresponding cell type at the top.
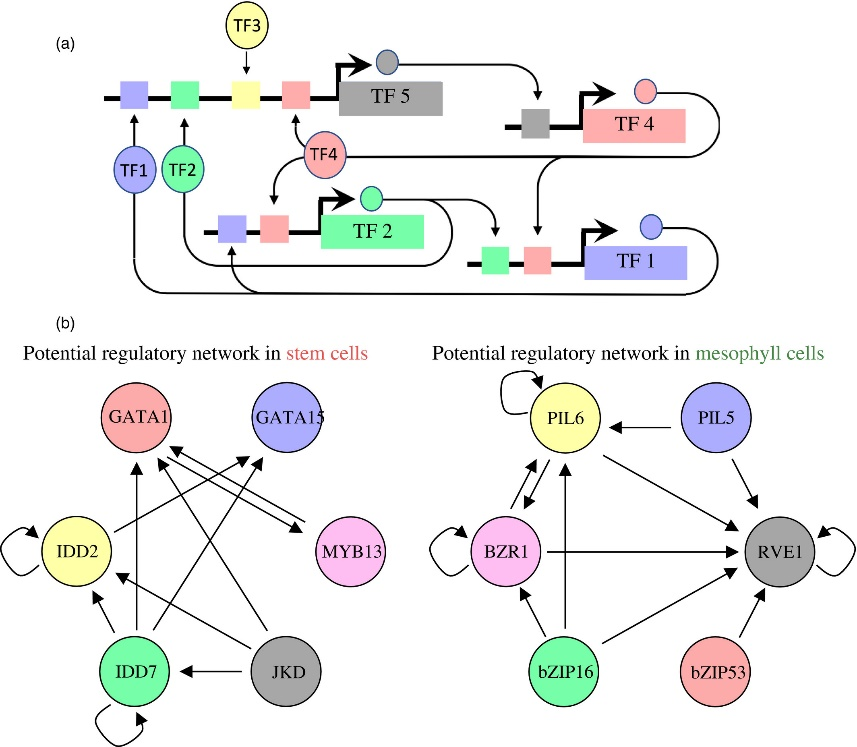
Figure 3.2.4 Proposed regulatory pathways for key transcription factors (TFs) in stem cells and mesophyll cells.
(a) Schematic for identifying regulatory interactions between transcription factors (TFs). A predicted binding site for a TF, such as TF5, may regulate the expression of another TF, such as TF4. Subsequently regulated TFs may regulate other TFs, making up a TF network that is active within a cell type.
(b) The putative regulatory networks for stem cells (left) and mesophyll (right) are shown. Each TF circle has regulatory inputs (stem cell‐ or mesophyll‐predicted TF‐binding site within its proximal regulatory regions) and regulatory outputs (that TF’s predicted binding site in the other TF gene’s proximal regulatory regions). For example, IDD7 has four regulatory outputs to IDD2, GATA1, GATA15 and itself, and one regulatory input to itself.
4. References
ChIP-Seq
Virtual screening
Virtual screening (VS) is a computational technique used in drug discovery to search libraries of small molecules in order to identify those structures which are most likely to bind to a drug target, typically a protein receptor or enzyme. Using the molecular docking between small molecule compounds and drug targets, VS can quickly select active compounds with druggability from tens to millions of molecules, greatly reducing the number of experimental compounds, shortening the research cycle, and reducing the cost of drug development. Virtual screening methods are mainly divided into structure-based virtual screening (SBVS) and ligand-based virtual screening (LBVS). According to reports, the positive rate of VS is 5%-30%. In nowadays, virtual screening has become the most promising drug development tool.
Virtual Screening
1. Overview
1.1 Introduction of Virtual Screening
Virtual screening (VS) is a computational technique used in drug discovery to search libraries of small molecules in order to identify those structures which are most likely to bind to a drug target, typically a protein receptor or enzyme. Using the molecular docking between small molecule compounds and drug targets, VS can quickly select active compounds with druggability from tens to millions of molecules, greatly reducing the number of experimental compounds, shortening the research cycle, and reducing the cost of drug development. Virtual screening methods are mainly divided into structure-based virtual screening (SBVS) and ligand-based virtual screening (LBVS). According to reports, the positive rate of VS is 5%-30%. In nowadays, virtual screening has become the most promising drug development tool.
1.1.1 SBVS
SBVS involves docking of candidate ligands into a protein target followed by applying a scoring function to estimate the likelihood that the ligand will bind to the protein with high affinity. The SBVS approach utilizes the knowledge of the 3D structure of the biological target in the process to select ligands with acceptable affinity and complementarity with the binding site. Then, the results can be used for subsequent experiments.
1.1.2 LBVS
LBVS is the approach of choice when the biological target is not known or its 3D structure is not available. Given a set of structurally diverse ligands that binds to a receptor, a model of the receptor can be built by exploiting the collective information contained in such set of ligands. These are known as pharmacophore models. A candidate ligand can then be compared to the pharmacophore model to determine whether it is compatible with it and therefore likely to bind. The approach we used for LBVS is based on searching molecules with shape similar to that of known actives, as such molecules will fit the target\’s binding site and hence will be likely to bind the target.
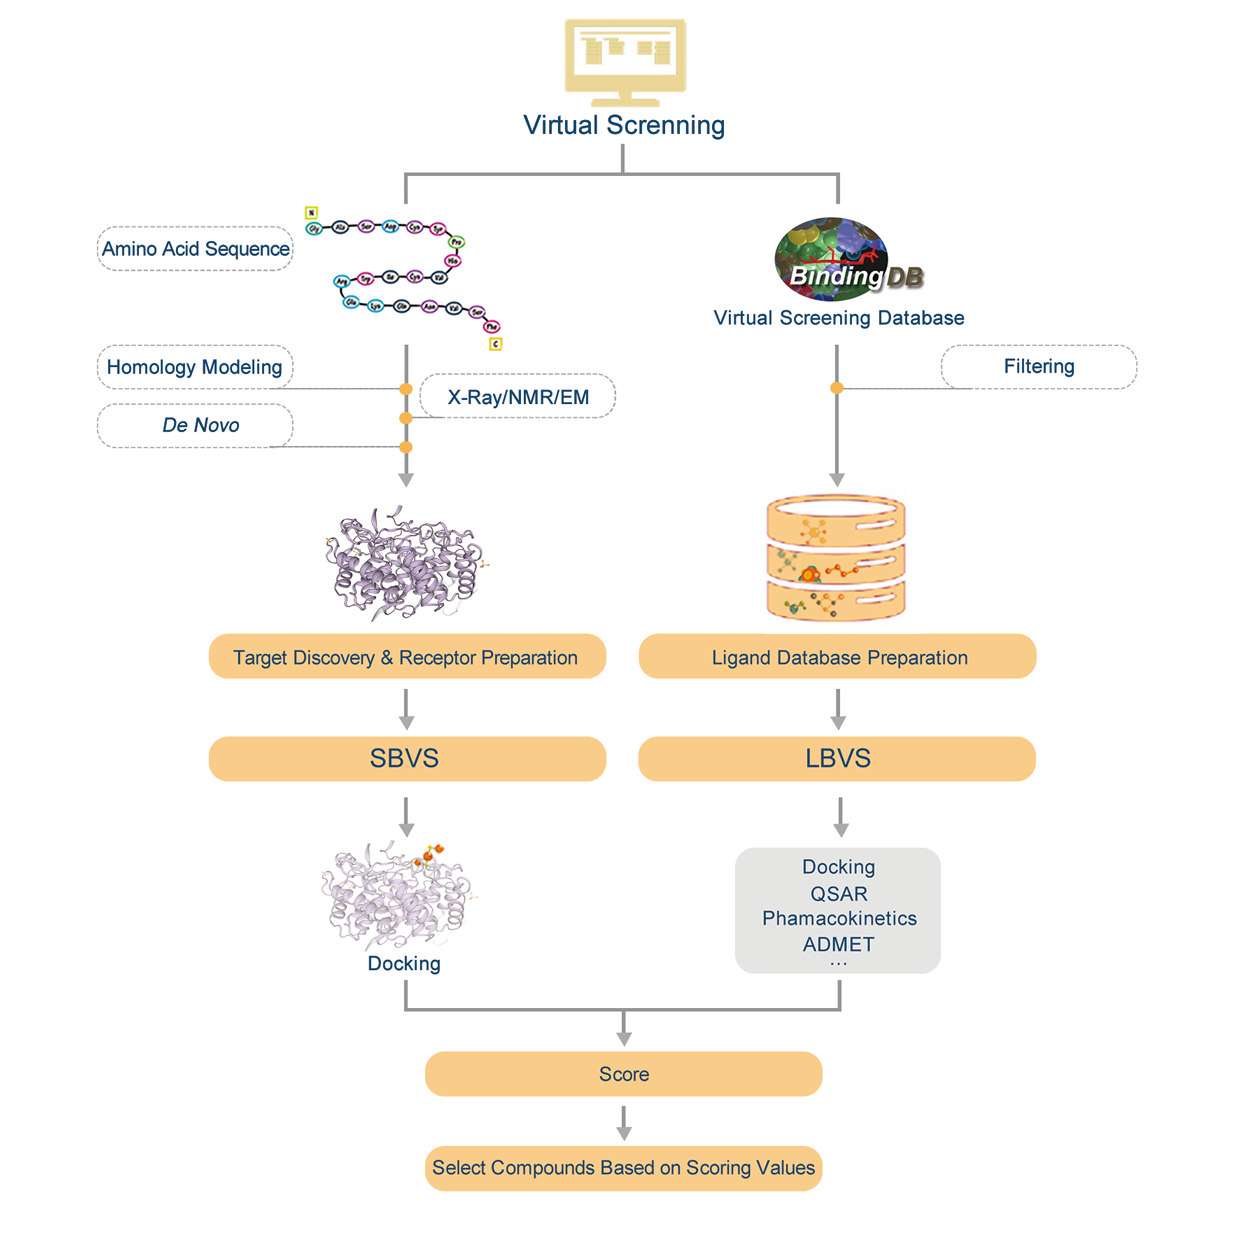
2. Workflow
Introduction:
1. Find homologous proteins of the protein we have within the database.
2. Do homology modeling online with SWISS-MODEL and evaluate the effectiveness of modeling according by GMQE&QMEAN.
3. Download PDB file.
4. Confirm the amino acid sequence and secondary structure of proteins.
5. Predict active sites or find active sites by protein alignments.
6. Preparations of molecule docking, such as structural optimization and prepare for glide grid files.
7. Molecule docking and evaluation.
3. Applications
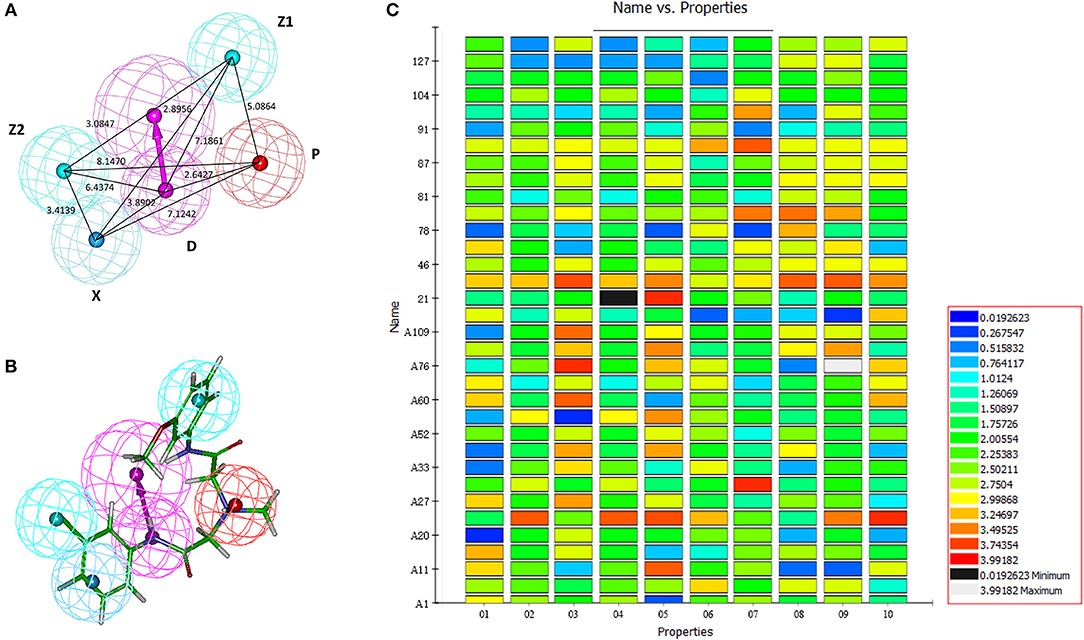
3.1 Pharmacophore-Based Virtual Screening Toward the Discovery of Novel Anti-echinococcal Compounds
3.1.1 Abstract
Echinococcosis is a serious helminthic zoonosis with a great impact on human health and livestock husbandry. However, the clinically used drugs (benzimidazoles) have a low cure rate, so alternative drugs are urgently needed. Currently, drug screenings for echinococcosis are mainly phenotype-based, and the efficiency of identifying active compounds is very low. With a pharmacophore model generated from the structures of active amino alcohols, researchers performed a virtual screening to discover novel compounds with anti-echinococcal activity. Sixty-two compounds from the virtual screening were tested on Echinococcus multilocularis protoscoleces, and 10 of these compounds were found to be active.
3.1.2 Results
Figure 3.1.1 Generation of the HipHop pharmacophore. (A) The HipHop-Hypo03 chemical features. The color of the pharmacophore features, namely, PI, HAR, HAL and HBD, are red, blue, cyan, and magenta, respectively. (B) S6 fit to HipHop-Hypo03. (C) The heat map of the 10 hypotheses in the test.
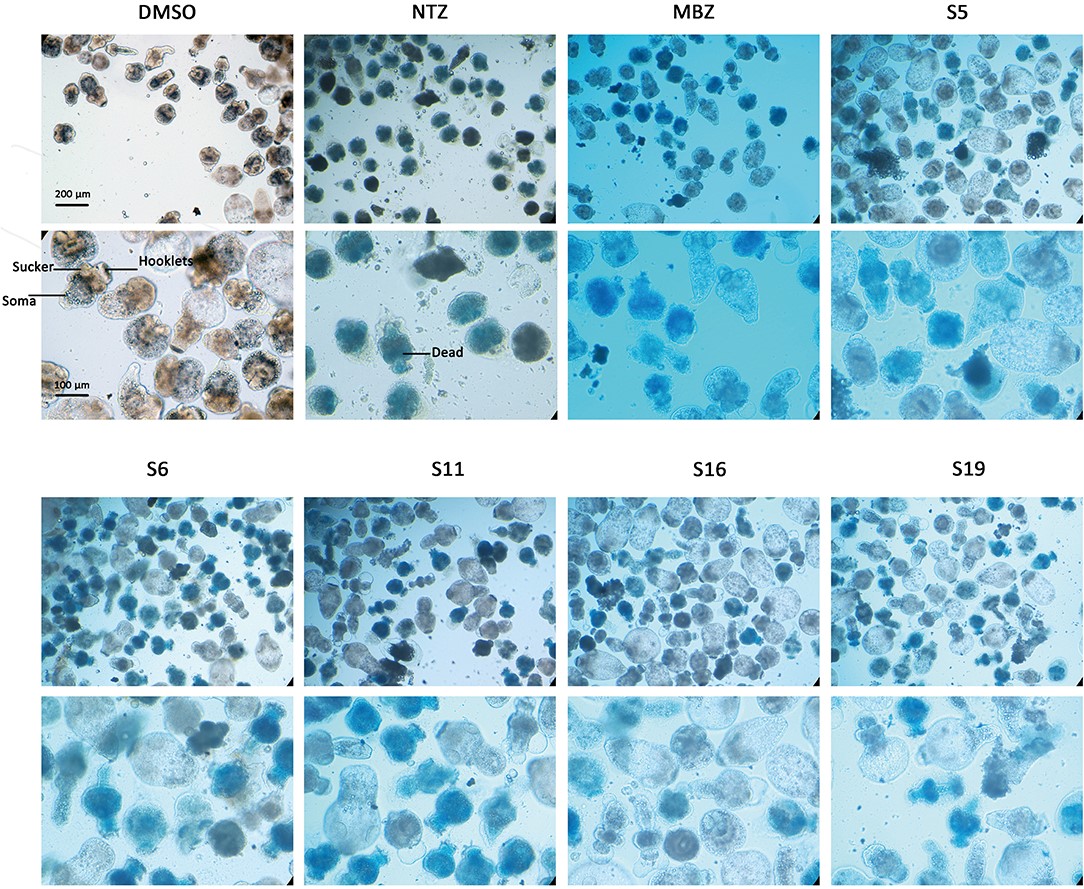
Figure 3.1.2 Morphology changes in Echinococcus multilocularis protoscoleces after incubation with the active compounds at 25 μM for 3 days. The normal protoscoleces in DMSO had intact soma, sucker and orderly arranged hooks. The drug treated parasites showed partial collapse and disruption of the inner structure, the detachment of hooks and staining with methylene blue.
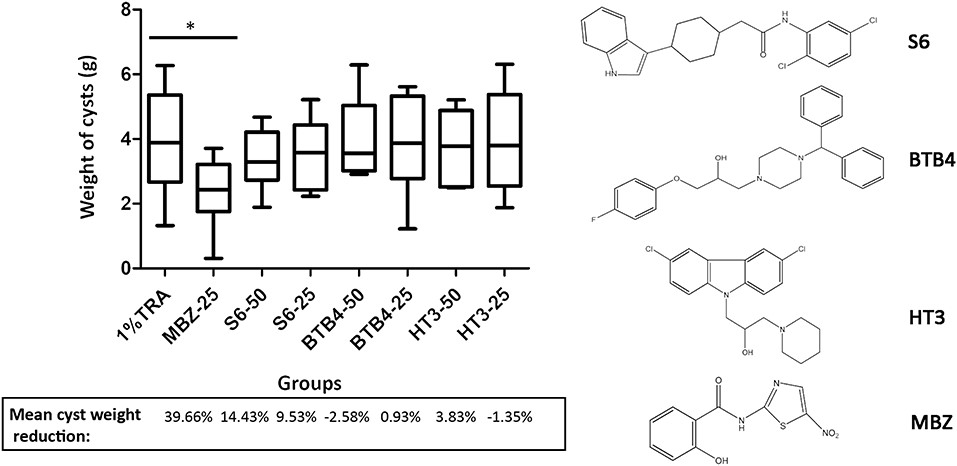
Figure 3.1.3 Treatment of mice secondarily infected with E. multilocularis. BALB/c mice were treated with S6, BTB4, and HT3 (25 mg/kg and 50 mg/kg), MBZ (25 mg/kg), or 1% TRA (control) for 28 days, n = 10. MBZ-25, BTB4-50, BTB4-25, HT3-50, and HT3-25 resulted in the deaths of 1, 4, 2, 3, and 2 mice, respectively. *p < 0.05.
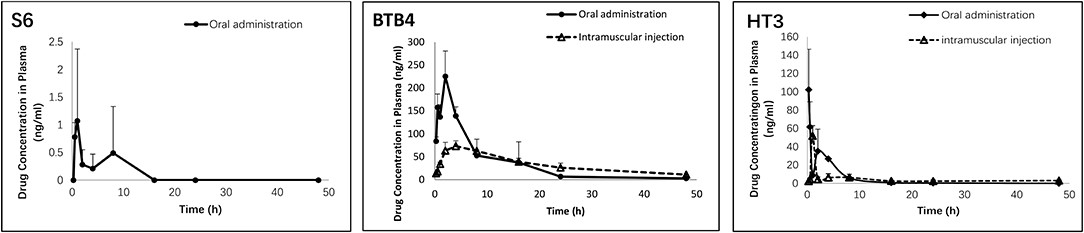
Figure 3.1.4 Pharmacokinetic parameters of S6, HT3 and BTB4 in the plasma of mice after oral (50 mg/kg) and intramuscular (12.5 mg/kg) administration.
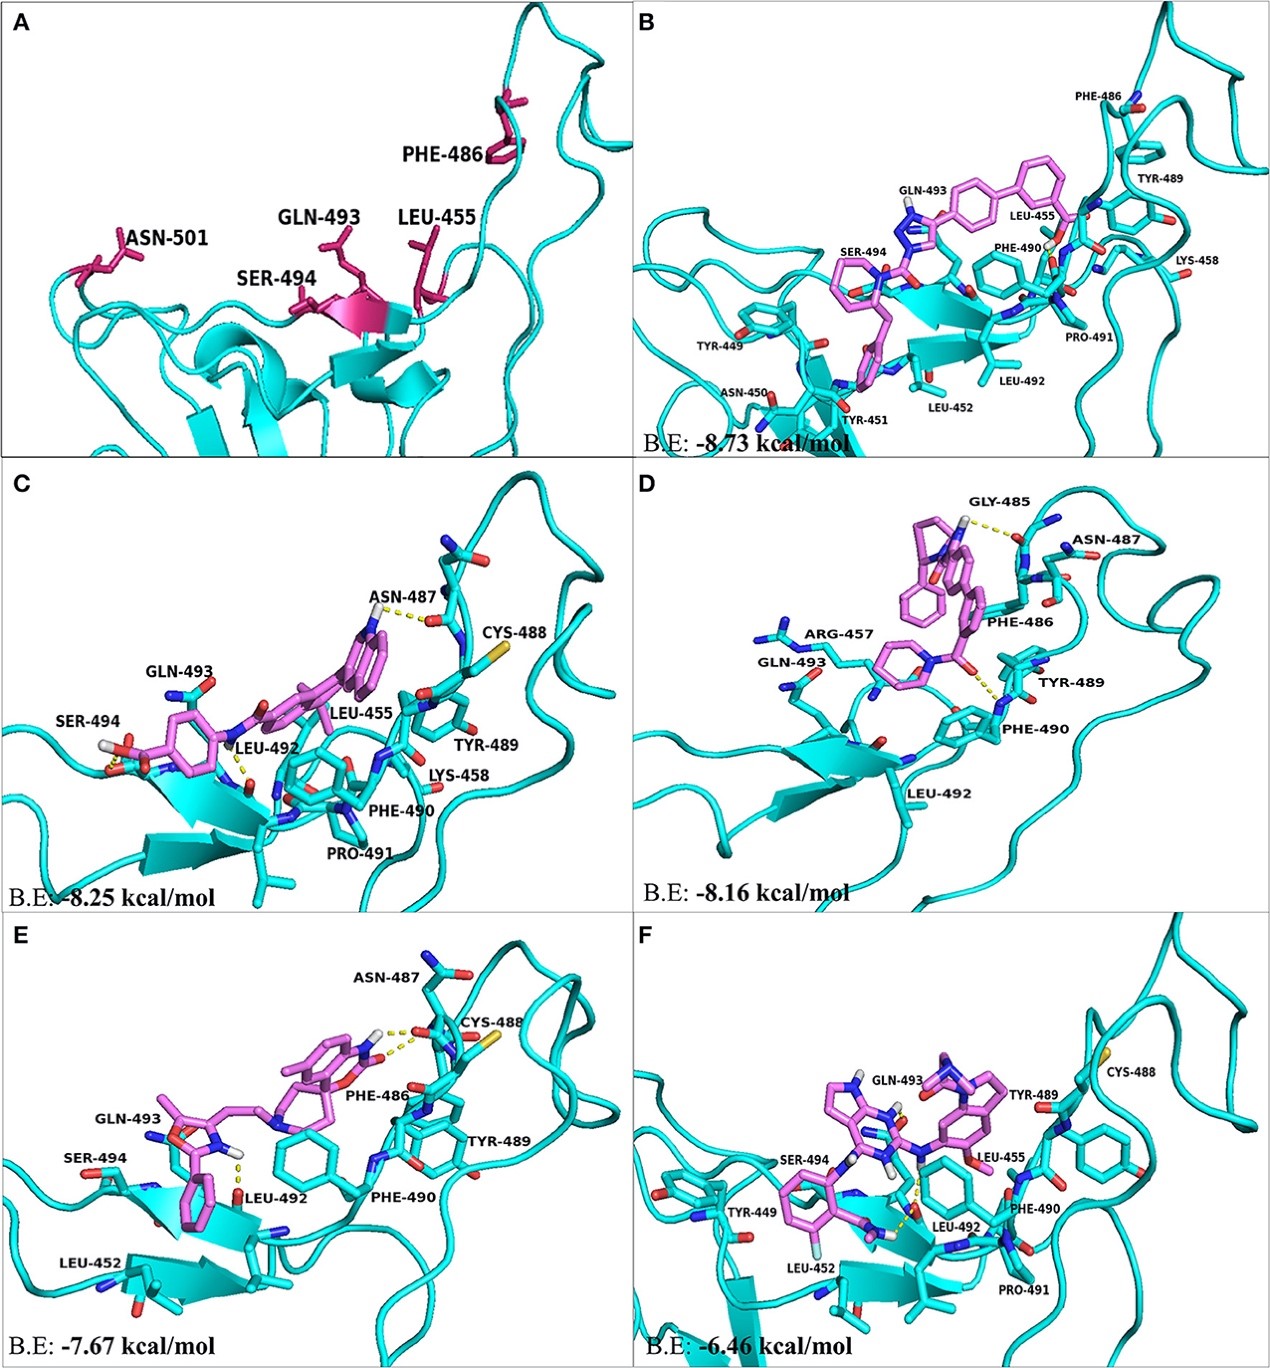
3.2 Identification of SARS-CoV-2 Cell Entry Inhibitors by Drug Repurposing Using in silico Structure-Based Virtual Screening Approach
3.2.1 Abstract
The rapidly spreading, highly contagious and pathogenic SARS-coronavirus 2 (SARS-CoV-2) associated Coronavirus Disease 2019 (COVID-19) has been declared as a pandemic by the World Health Organization (WHO). The novel 2019 SARS-CoV-2 enters the host cell by binding of the viral surface spike glycoprotein (S-protein) to cellular angiotensin converting enzyme 2 (ACE2) receptor. The virus specific molecular interaction with the host cell represents a promising therapeutic target for identifying SARS-CoV-2 antiviral drugs. The repurposing of drugs can provide a rapid and potential cure toward exponentially expanding COVID-19. Thereto, high throughput virtual screening approach was used to investigate FDA approved LOPAC library drugs against both the receptor binding domain of spike protein (S-RBD) and ACE2 host cell receptor. Primary screening identified a few promising molecules for both the targets, which were further analyzed in details by their binding energy, binding modes through molecular docking, dynamics and simulations. Evidently, GR 127935 hydrochloride hydrate, GNF-5, RS504393, TNP, and eptifibatide acetate were found binding to virus binding motifs of ACE2 receptor. Additionally, KT203, BMS195614, KT185, RS504393, and GSK1838705A were identified to bind at the receptor binding site on the viral S-protein. These identified molecules may effectively assist in controlling the rapid spread of SARS-CoV-2 by not only potentially inhibiting the virus at entry step but are also hypothesized to act as anti-inflammatory agents, which could impart relief in lung inflammation. Timely identification and determination of an effective drug to combat and tranquilize the COVID-19 global crisis is the utmost need of hour. Further, prompt in vivo testing to validate the anti-SARS-CoV-2 inhibition efficiency by these molecules could save lives is justified.
3.2.2 Results
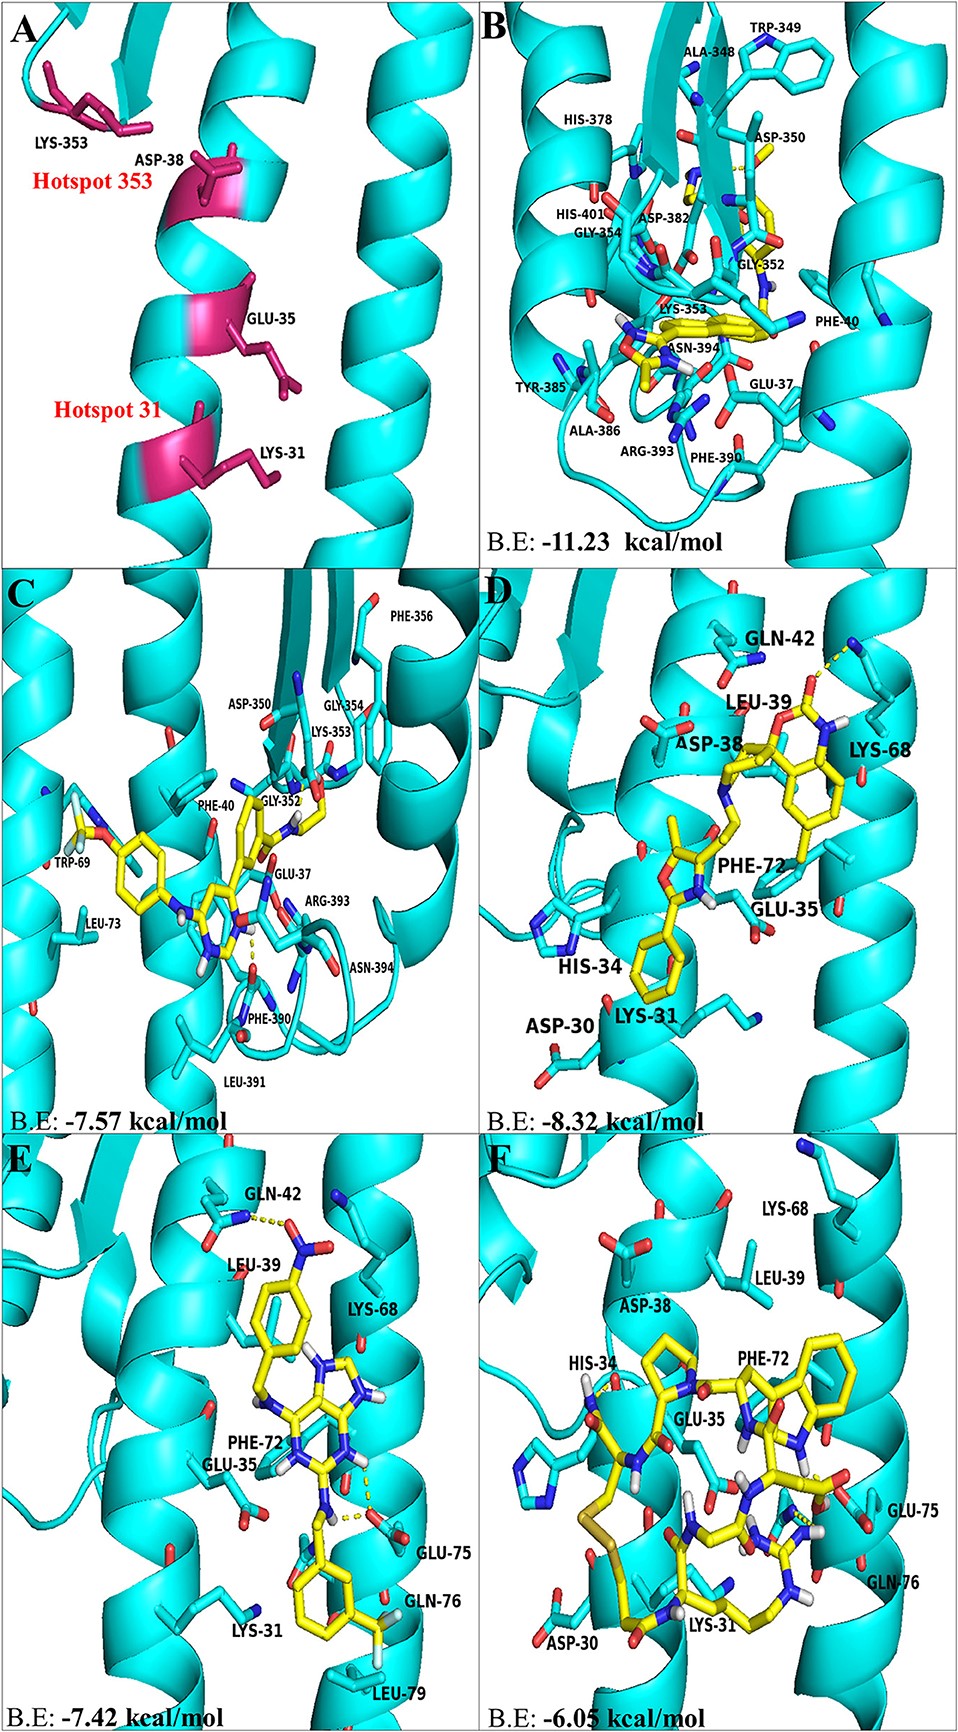
Figure 3.2.1 The top hit selected ligands from LOPAC library showing molecular interactions with ACE2 receptor of the host cell. (A) Hotspot 31 and hotspot 353 residues of ACE2 receptor responsible for recognizing S-RBD of SARS-CoV-2. (B) Molecular interactions of GR hydrochloride with ACE2 receptor. (C) Molecular interactions of GNF-5 with ACE2 receptor. (D) Molecular interactions of RS504393 with ACE2 receptor. (E) Molecular interactions of TNP with ACE2 receptor. (F) Molecular interactions of eptifibatide acetate with ACE2 receptor. Blue ribbons corresponds to residues of ACE2 receptor and yellow stick model represents residues of Ligands. BE, Binding energy.
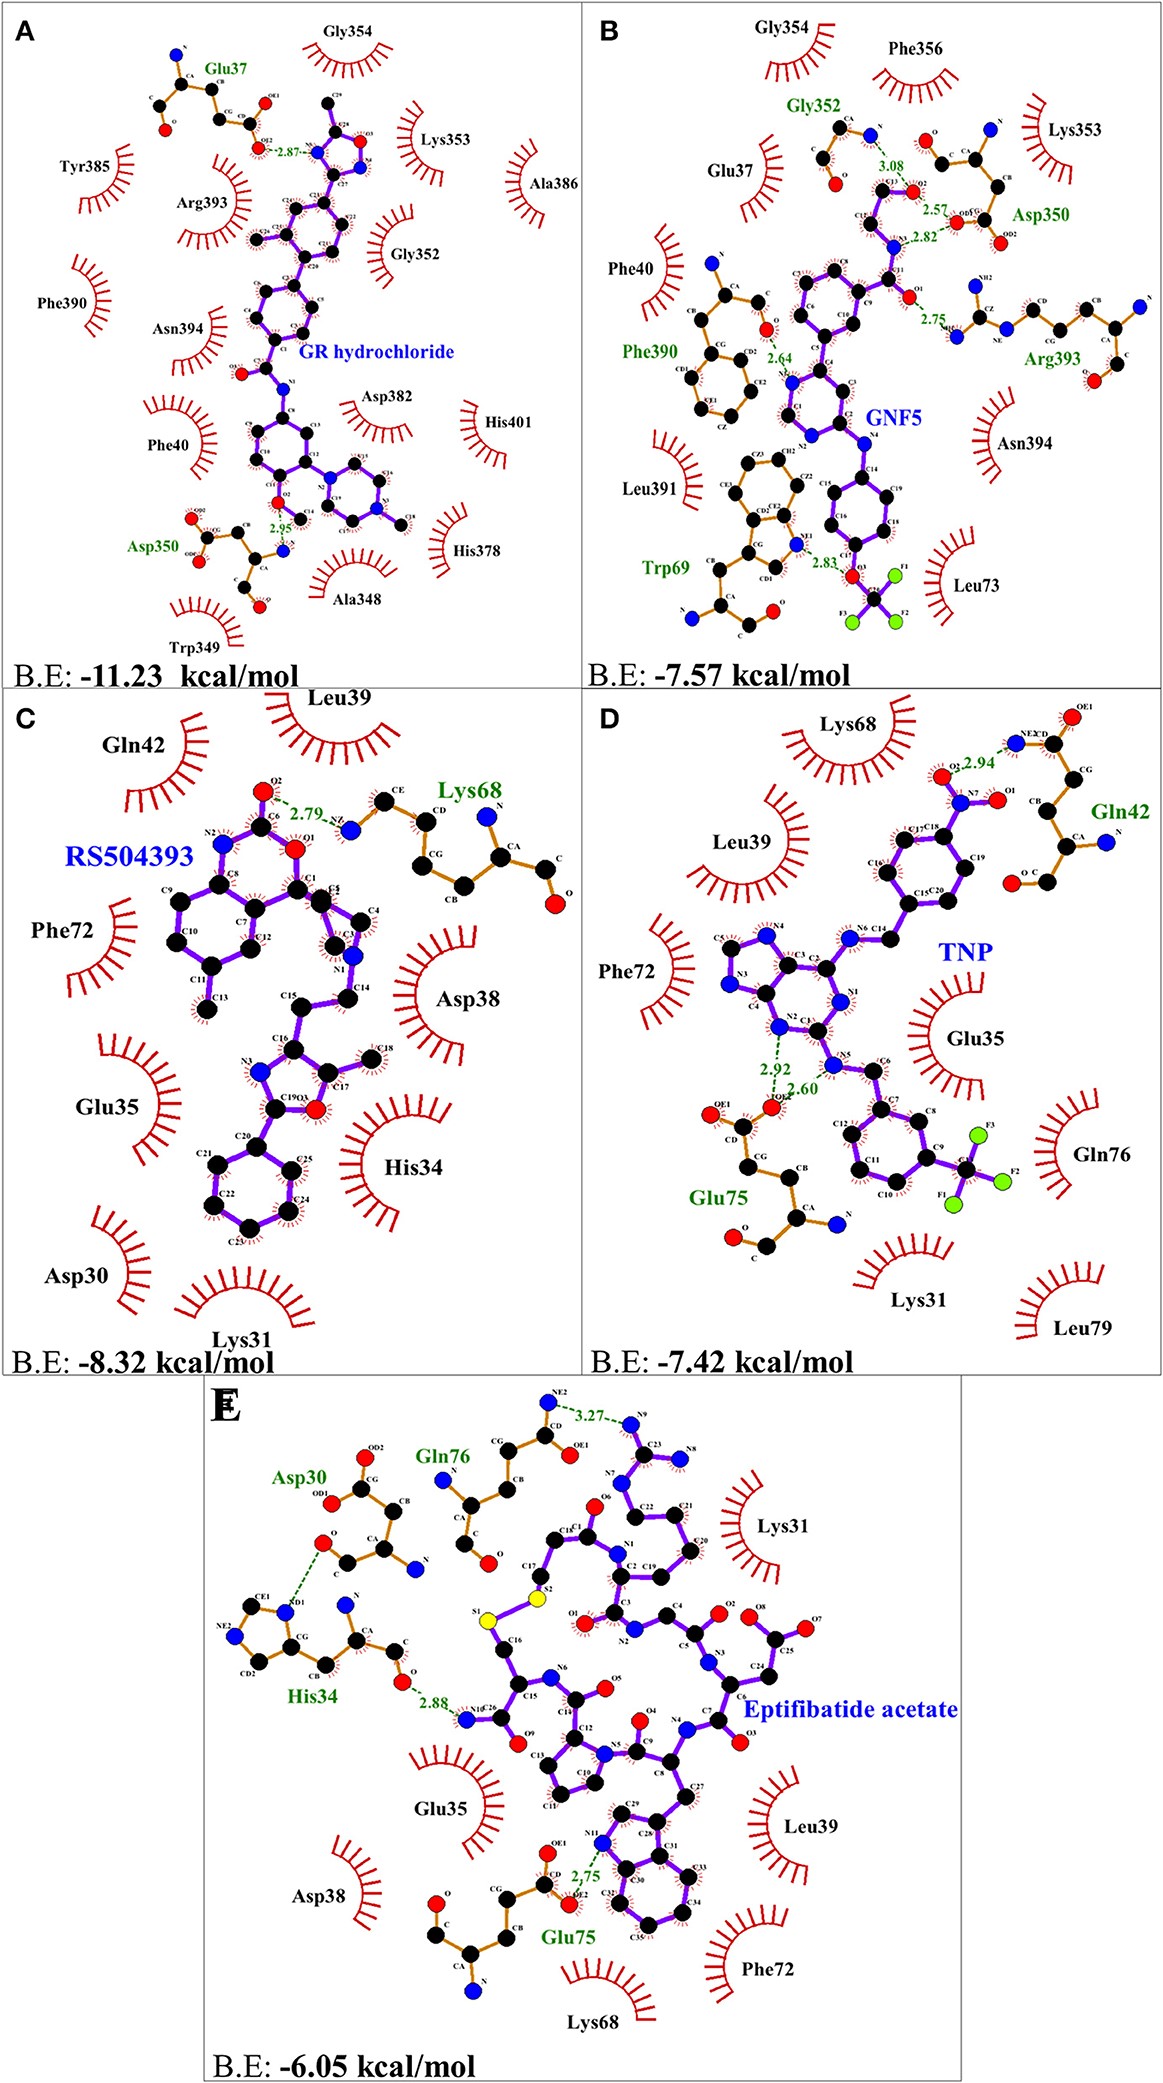
Figure 3.2.2 Two dimensional representation of H-bonds and hydrophobic interactions of selected compound with ACE2 receptor using LigPlot. (A) GR hydrochloride (B) GNF-5 (C) RS5049393 (D) TNP (E) Eptifibatide acetate. Ligands are colored and represented in purple color, H-bonds are displayed in green dotted lines, red stellations represents hydrophobic interactions, and bonds of proteins are shown in brown color.
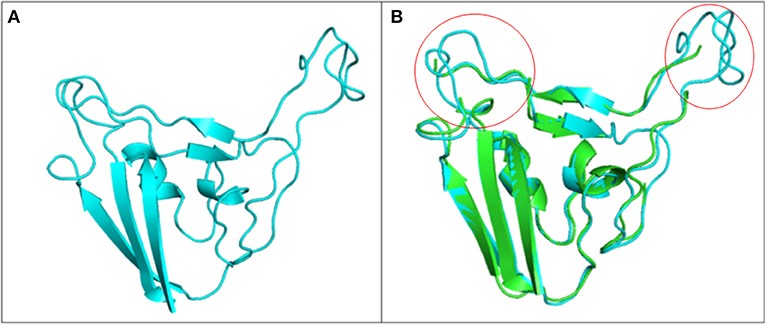
Figure 3.2.3 Structure of S1 subunit of SARS-CoV-2 (PMDB ID: PM0082972). (A) Cartoon representation of predicted S1 subunit of SARS-CoV-2. (B) Superimposition of template (PDB ID: 6VSB) and modeled S-RBD of S-protein. Predicted S-RBD and template are sky blue and green in color. Encircled area represents missing residues in loops of template S-protein which are modeled for S-RBD protein of SARS-CoV-2 using SWISS MODEL.
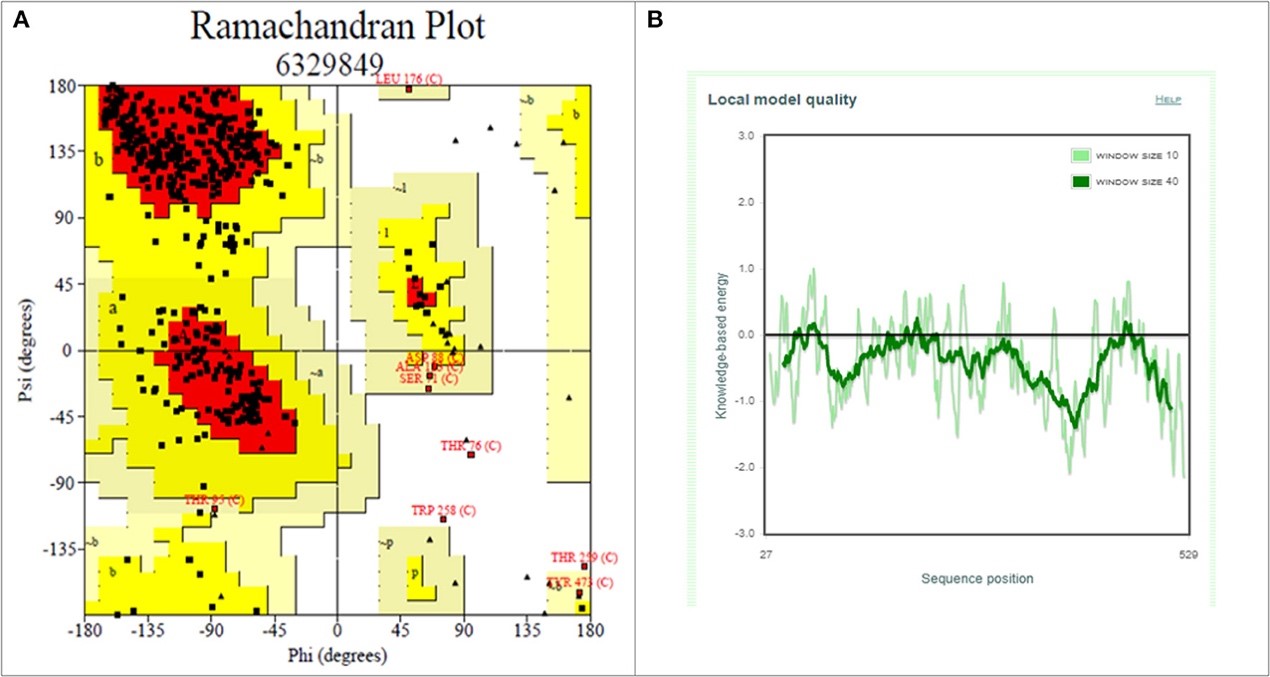
Figure 3.2.4 Structure validation of S1 subunit of S-protein by ProCheck and ProSA server. (A) ProCheck Ramachandran Plot where red, bright yellow and light yellow color represents that 99.4% residues of predicted S1 subunit of S-protein are present in favorably allowed region and 0.7% residues are present in disallowed region (lightest yellow). (B) Energy profile of modeled spike protein of SARS-CoV-2 as calculated by ProSA.
Figure 3.2.5 The top hit selected ligands from LOPAC library showing molecular interactions with S-RBD protein of SARS-CoV-2. (A) S-RBD residues responsible for interacting with ACE2 receptor. (B) Molecular interactions of KT203 with S-RBD. (C) Molecular interactions of BMS195614 with S-RBD. (D) Molecular interactions of KT185 with S-RBD. (E) Molecular interactions of RS504393 with S-RBD. (F) Molecular interactions of GSK1838705A with S-RBD. Blue ribbons corresponds S-RBD of spike protein of SARS-CoV-2 and violet stick model represents residues of Ligands.
4. References
[1] Liu C, Yin J, Yao J, Xu Z, Tao Y, Zhang H. Pharmacophore-Based Virtual Screening Toward the Discovery of Novel Anti-echinococcal Compounds. Front Cell Infect Microbiol. 2020; 10: 118. Published 2020 Mar 20. doi:10.3389/fcimb.2020.00118
[2] Choudhary S, Malik YS, Tomar S. Identification of SARS-CoV-2 Cell Entry Inhibitors by Drug Repurposing Using in silico Structure-Based Virtual Screening Approach. Front Immunol. 2020; 11: 1664. doi:10.3389/fimmu.2020.01664
Metabolomics
Metabolomics/Metabolomics is a newly developed discipline following genomics and proteomics. Its main goal is to quantitatively study the multiple dynamic responses of living organisms to external stimuli, physiological and pathological changes, and genetic mutations in the level of metabolites in the body.
Targeted/Untargeted Metabolomics
1. Overview
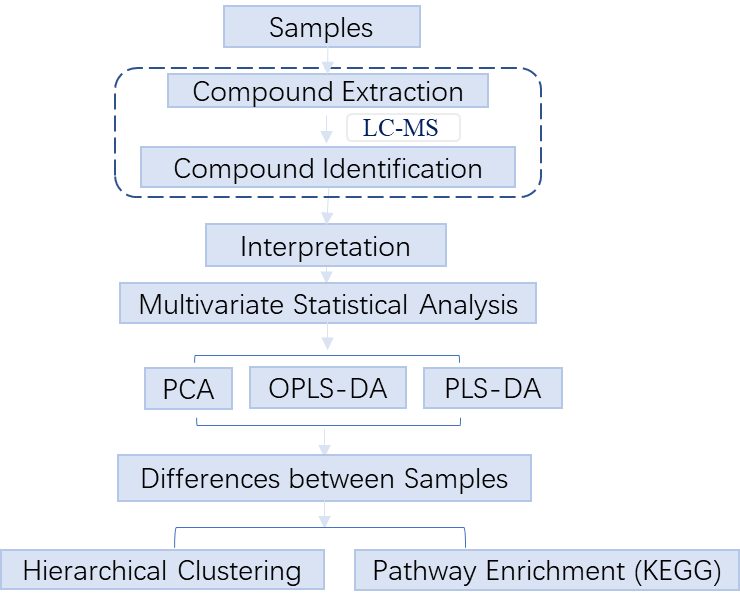
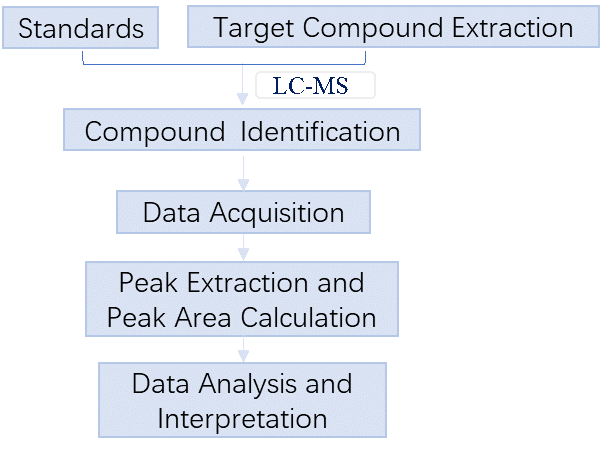
Untargeted metabolomics, or discovery metabolomics, focuses on global detection and relative quantitation of small molecules in a sample without prejudice. APExBIO uses LC-MS to collect the metabolite spectra of samples, compares the content of metabolites in different groups of samples, finds different metabolites, and explores the metabolic pathways between different metabolites. It can be used for biomarker discovery, disease diagnosis, etc. Targeted metabolomics, or quantitative metabolomics, focuses on measuring well-defined groups of metabolites, with opportunities for absolute quantitation. APExBIO uses UHPLC-QQQ-MS (Agilent 1290 UHPLC-6470 MS) to quickly and accurately determine the content of target small molecules in samples, and perform multivariate statistics and KEGG metabolic pathway enrichment analysis.
2. Workflow
Untargeted metabolomics
Targeted metabolomics
3. Applications
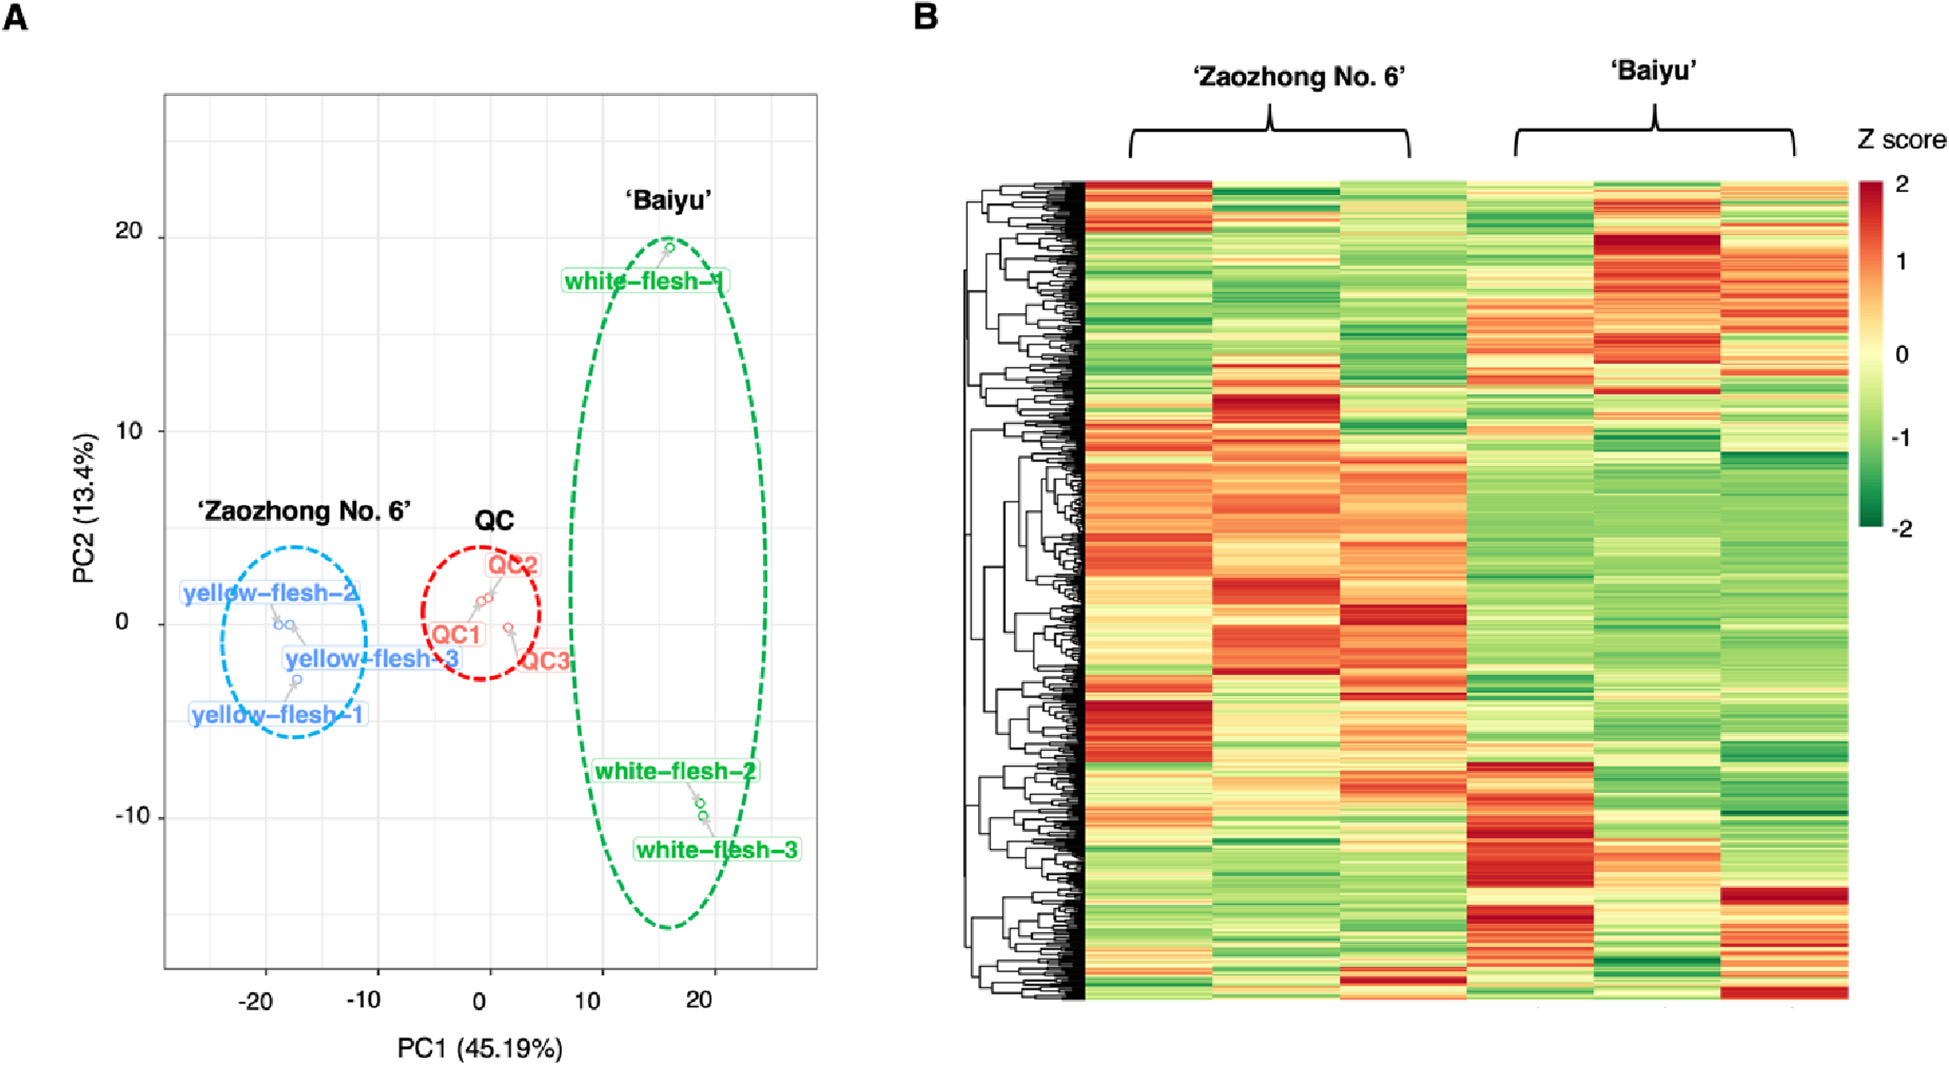
3.1 Identification of key taste components in loquat using widely targeted metabolomics
Abstract
Loquats can be divided into white- and yellow-fleshed cultivars. Generally, white-fleshed cultivars taste better than yellow-fleshed cultivars. Currently, metabolic causes of differences in taste are unknown, due to the lack of a large-scale and comprehensive investigation of metabolites in loquat fruit. Here, we performed a LC-MS/MSbased widely targeted metabolome analysis on two cultivars, ‘Baiyu’ (white-fleshed) and ‘ZaozhongNo. 6’ (yellow-fleshed). A total of 536 metabolites were identified, 193 of which (including 7 carbohydrates, 12 organic acids and 8 amino acids) were different between the cultivars. Pathway enrichment analysis also identified significant differences in phenolic pathways between the cultivars. Our results suggest that taste differences between the cultivars can be explained by variations in composition and abundance of carbohydrates, organic acids, amino acids, and phenolics. This study provides new insights into the underlying metabolic causes of taste variation in loquat.
Figure 3.1.1 Differential fruit chemotype between ‘Baiyu’ and ‘Zaozhong No. 6’. (A) PCA analysis of metabolites identified from ‘Baiyu’ and ‘Zaozhong No. 6’. Equal volumes of ‘Baiyu’ and ‘Zaozhong No. 6’ fruit samples were mixed for use as a quality control (QC). (B) Cluster analysis of metabolites from samples of ‘Baiyu’ and ‘Zaozhong No. 6’. The colour indicates the level of accumulation of each metabolite, from low (green) to high (red). The Z-score represents the deviation from the mean by standard deviation units
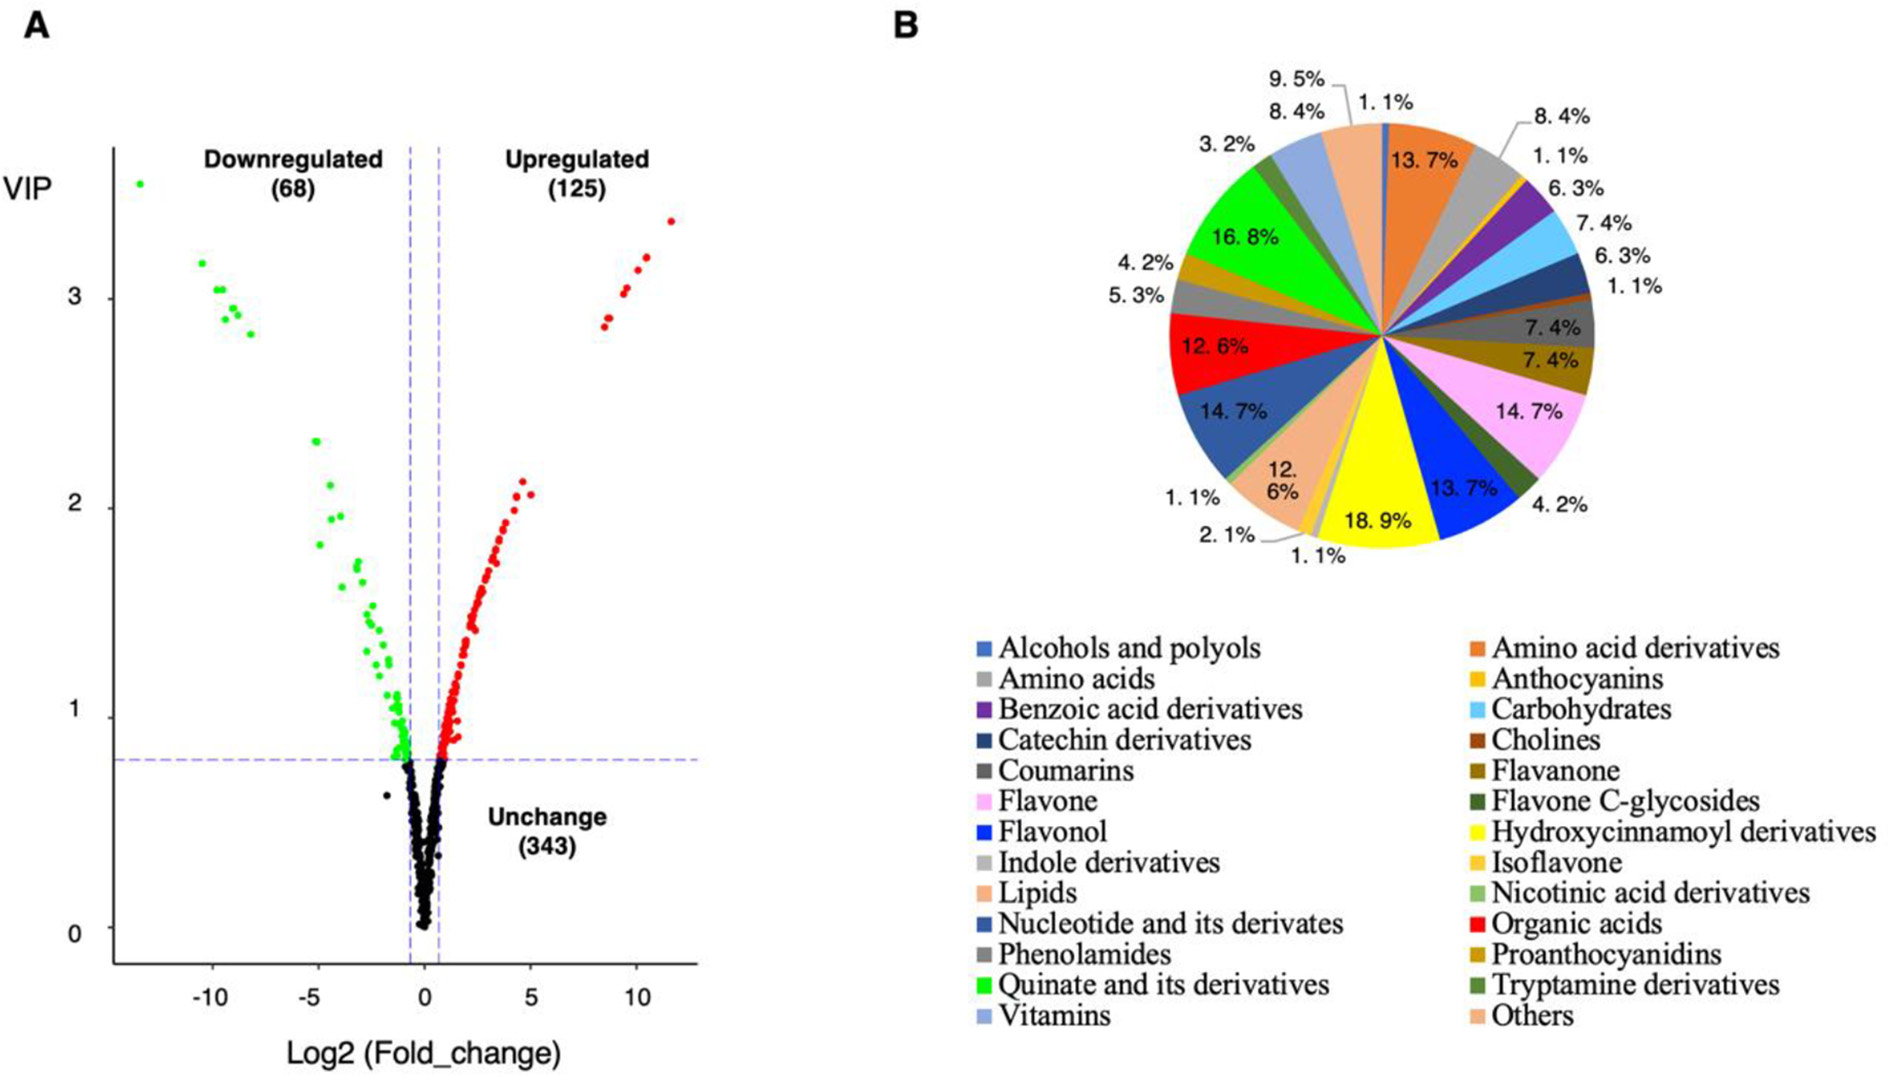
Differentially accumulating metabolites between ‘Baiyu’ and ‘Zaozhong No. 6’. (A)Volcano plot of the 536 metabolites identified. Differential metabolites were defined as metabolites with fold change ≥ 1.6 or ≤ 0.625 in ‘Zaozhong No. 6’ compared to ‘Baiyu’. A threshold of VIP ≥ 0.8 was used to separate differential metabolites from unchanged metabolites. (B) Pie chart depicting the biochemical categories of the differential metabolites identified between ‘Baiyu’ and ‘Zaozhong No. 6’.
Conclusion
In this study, we have performed successfully LC-MS/MS-based metabolic analysis to systematically compare taste differences between loquat cultivars. This work provides comprehensive information on both metabolite compositions and abundances in loquat, an important commercial fruit. The results infer that these compositional differences and concentrations of carbohydrates, organic acids, amino acids, and phenolic compounds might be the underlying causes of the differences in taste between white- and yellow-fleshed loquat.
3.2 High-throughput non-targeted metabolomics study of the effects of perfluorooctane sulfonate (PFOS) on the metabolic characteristics of A. thaliana leaves
Abstract
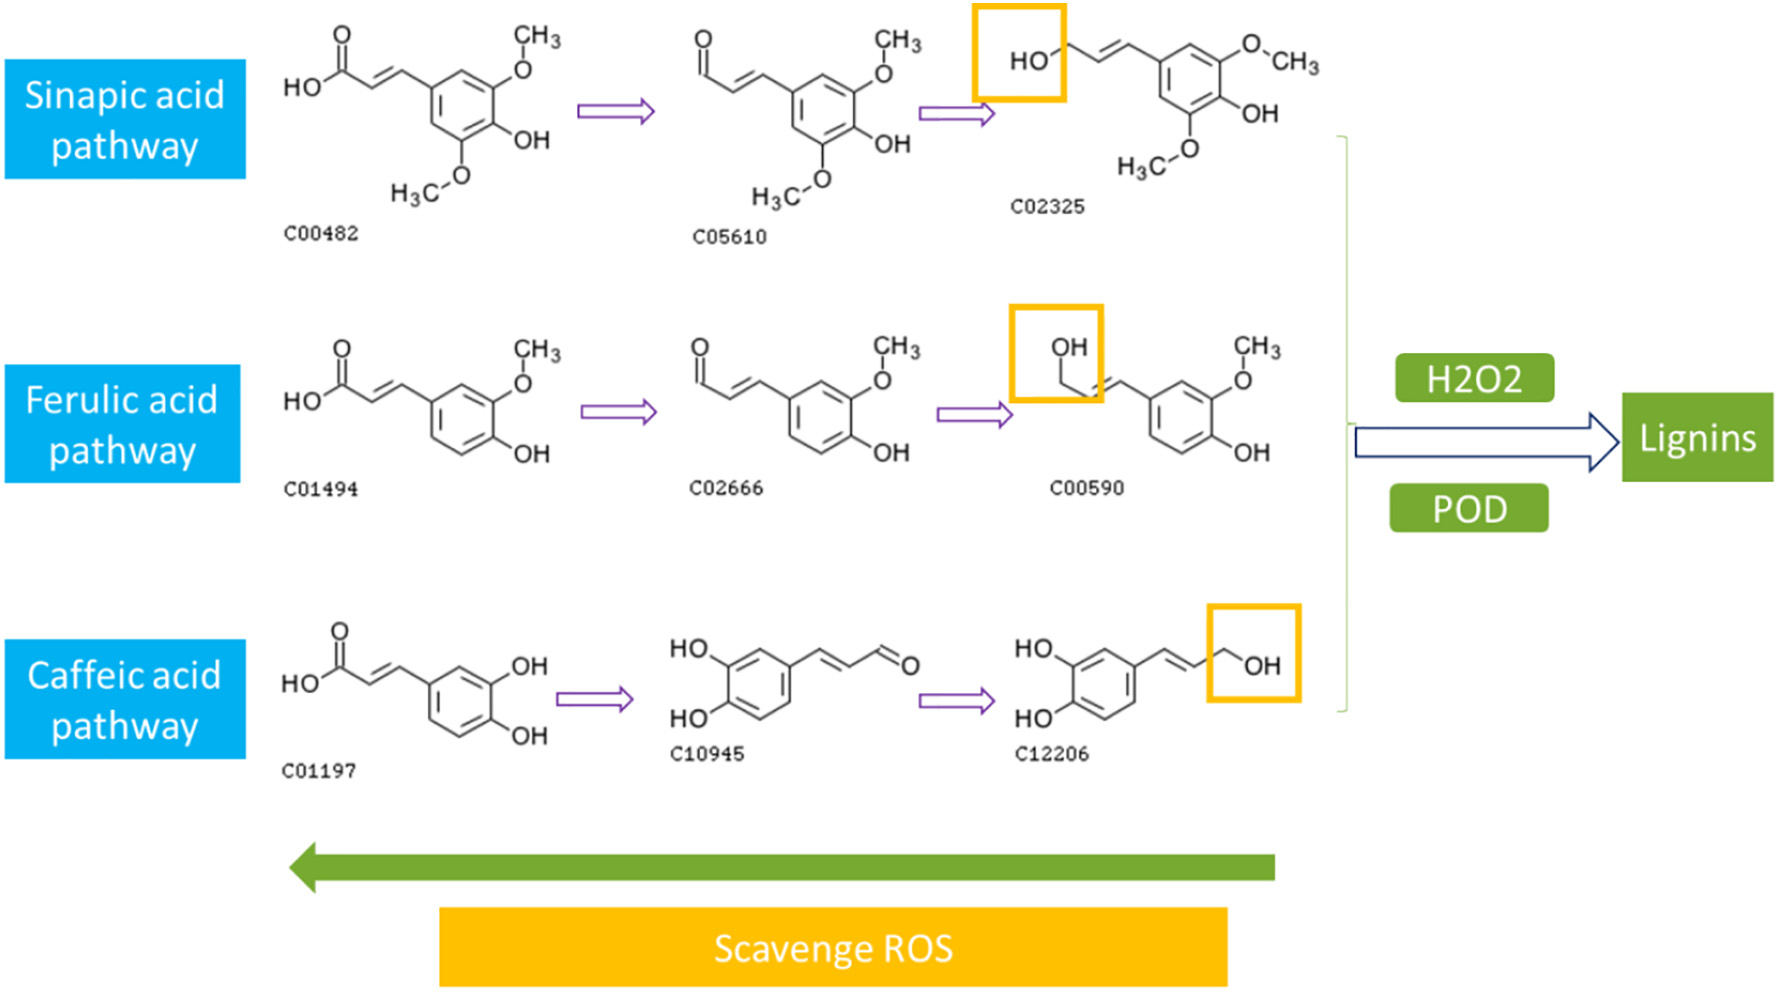
The ecotoxicity of perfluorooctane sulfonate (PFOS) is complex and has been reported in animals (including fish and mice), but the effects of PFOS in plants, especially the toxic mechanisms, have rarely been studied. Highthroughput nontargeted metabolomics methods for comprehensive assessment were selected to study changes in metabolic characteristics in Arabidopsis thaliana leaves by exposure to different concentrations of PFOS throughout the growth period (30 days). All the metabolites were analyzed by PCA and OPLS-DA methods, by the cutoff of VIP and p-value, 53 biomarkers were found and significantly regulated, all amino acids except glutamate were inhibited and probably associated with binding to protein, auxin and cytokinin of phytohormones were significantly down-regulated. In response mechanism to oxidative stress from PFOS, the phenylpropanoid pathway were fully activated to form several polyphenols and further enhanced into several flavonoids against the reactive oxygen species (ROS) as the primary defend pathway, in addition, ascorbate, trehalose and nicotinamide also were activated and help decrease the damage from oxidative stress. These results provide insights into the mechanism underlying the phytotoxicity of PFOS.
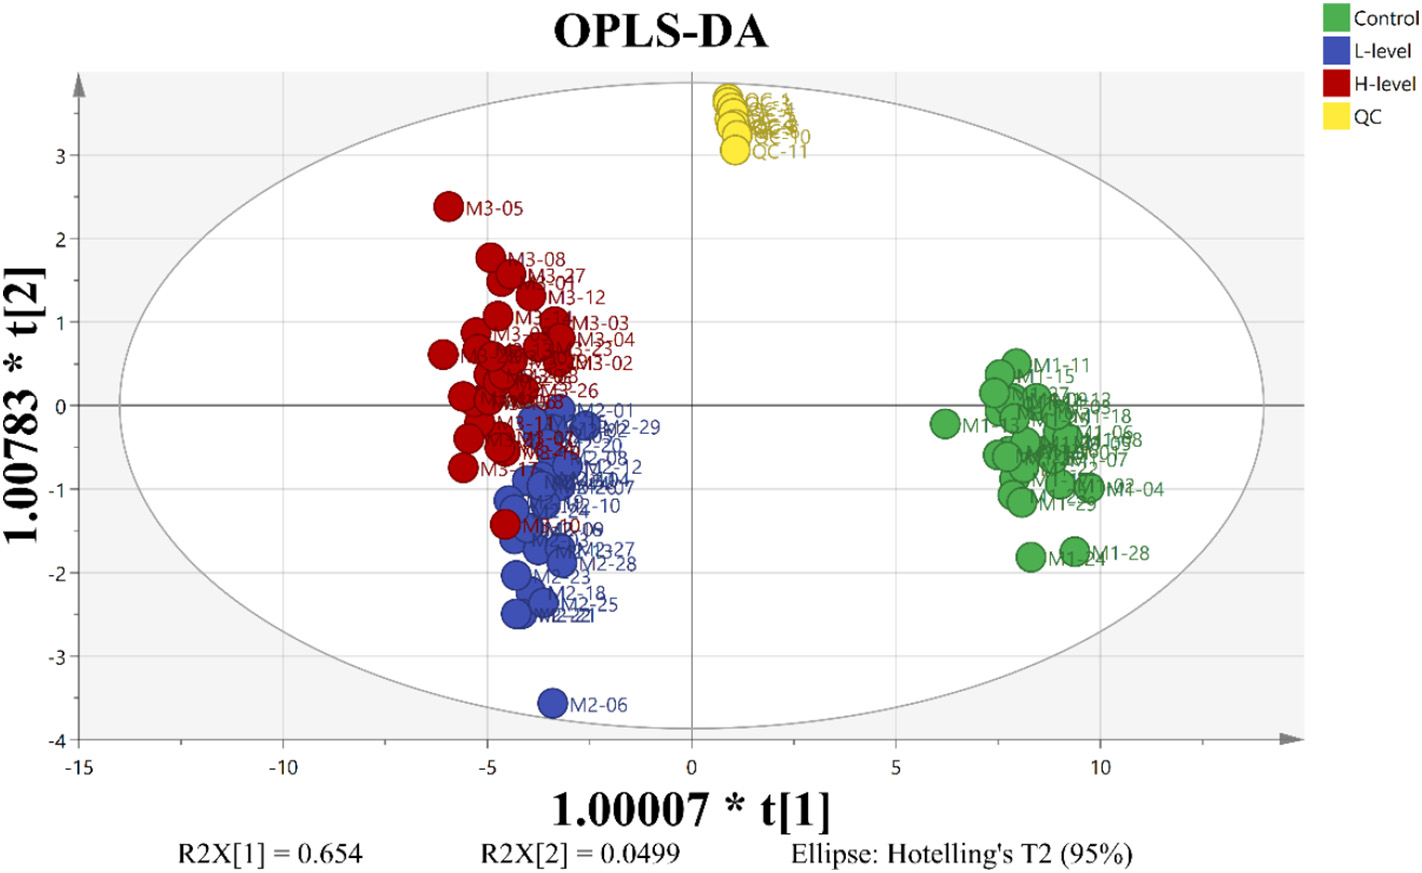
Figure 3.2.1 OPLS-DA score map based on metabolic characteristics of mature A. thaliana leaves exposed to 0.00, 0.01 and 1.00 mg/L PFOS. R2X(cum) = 0.861, R2(cum) = 0.851, Q2(cum) = 0.814 (red for 1.00 mg/L PFOS exposure group, blue for 0.01 mg/L PFOS exposure group, green for the control group of PFOS, yellow for the QC).
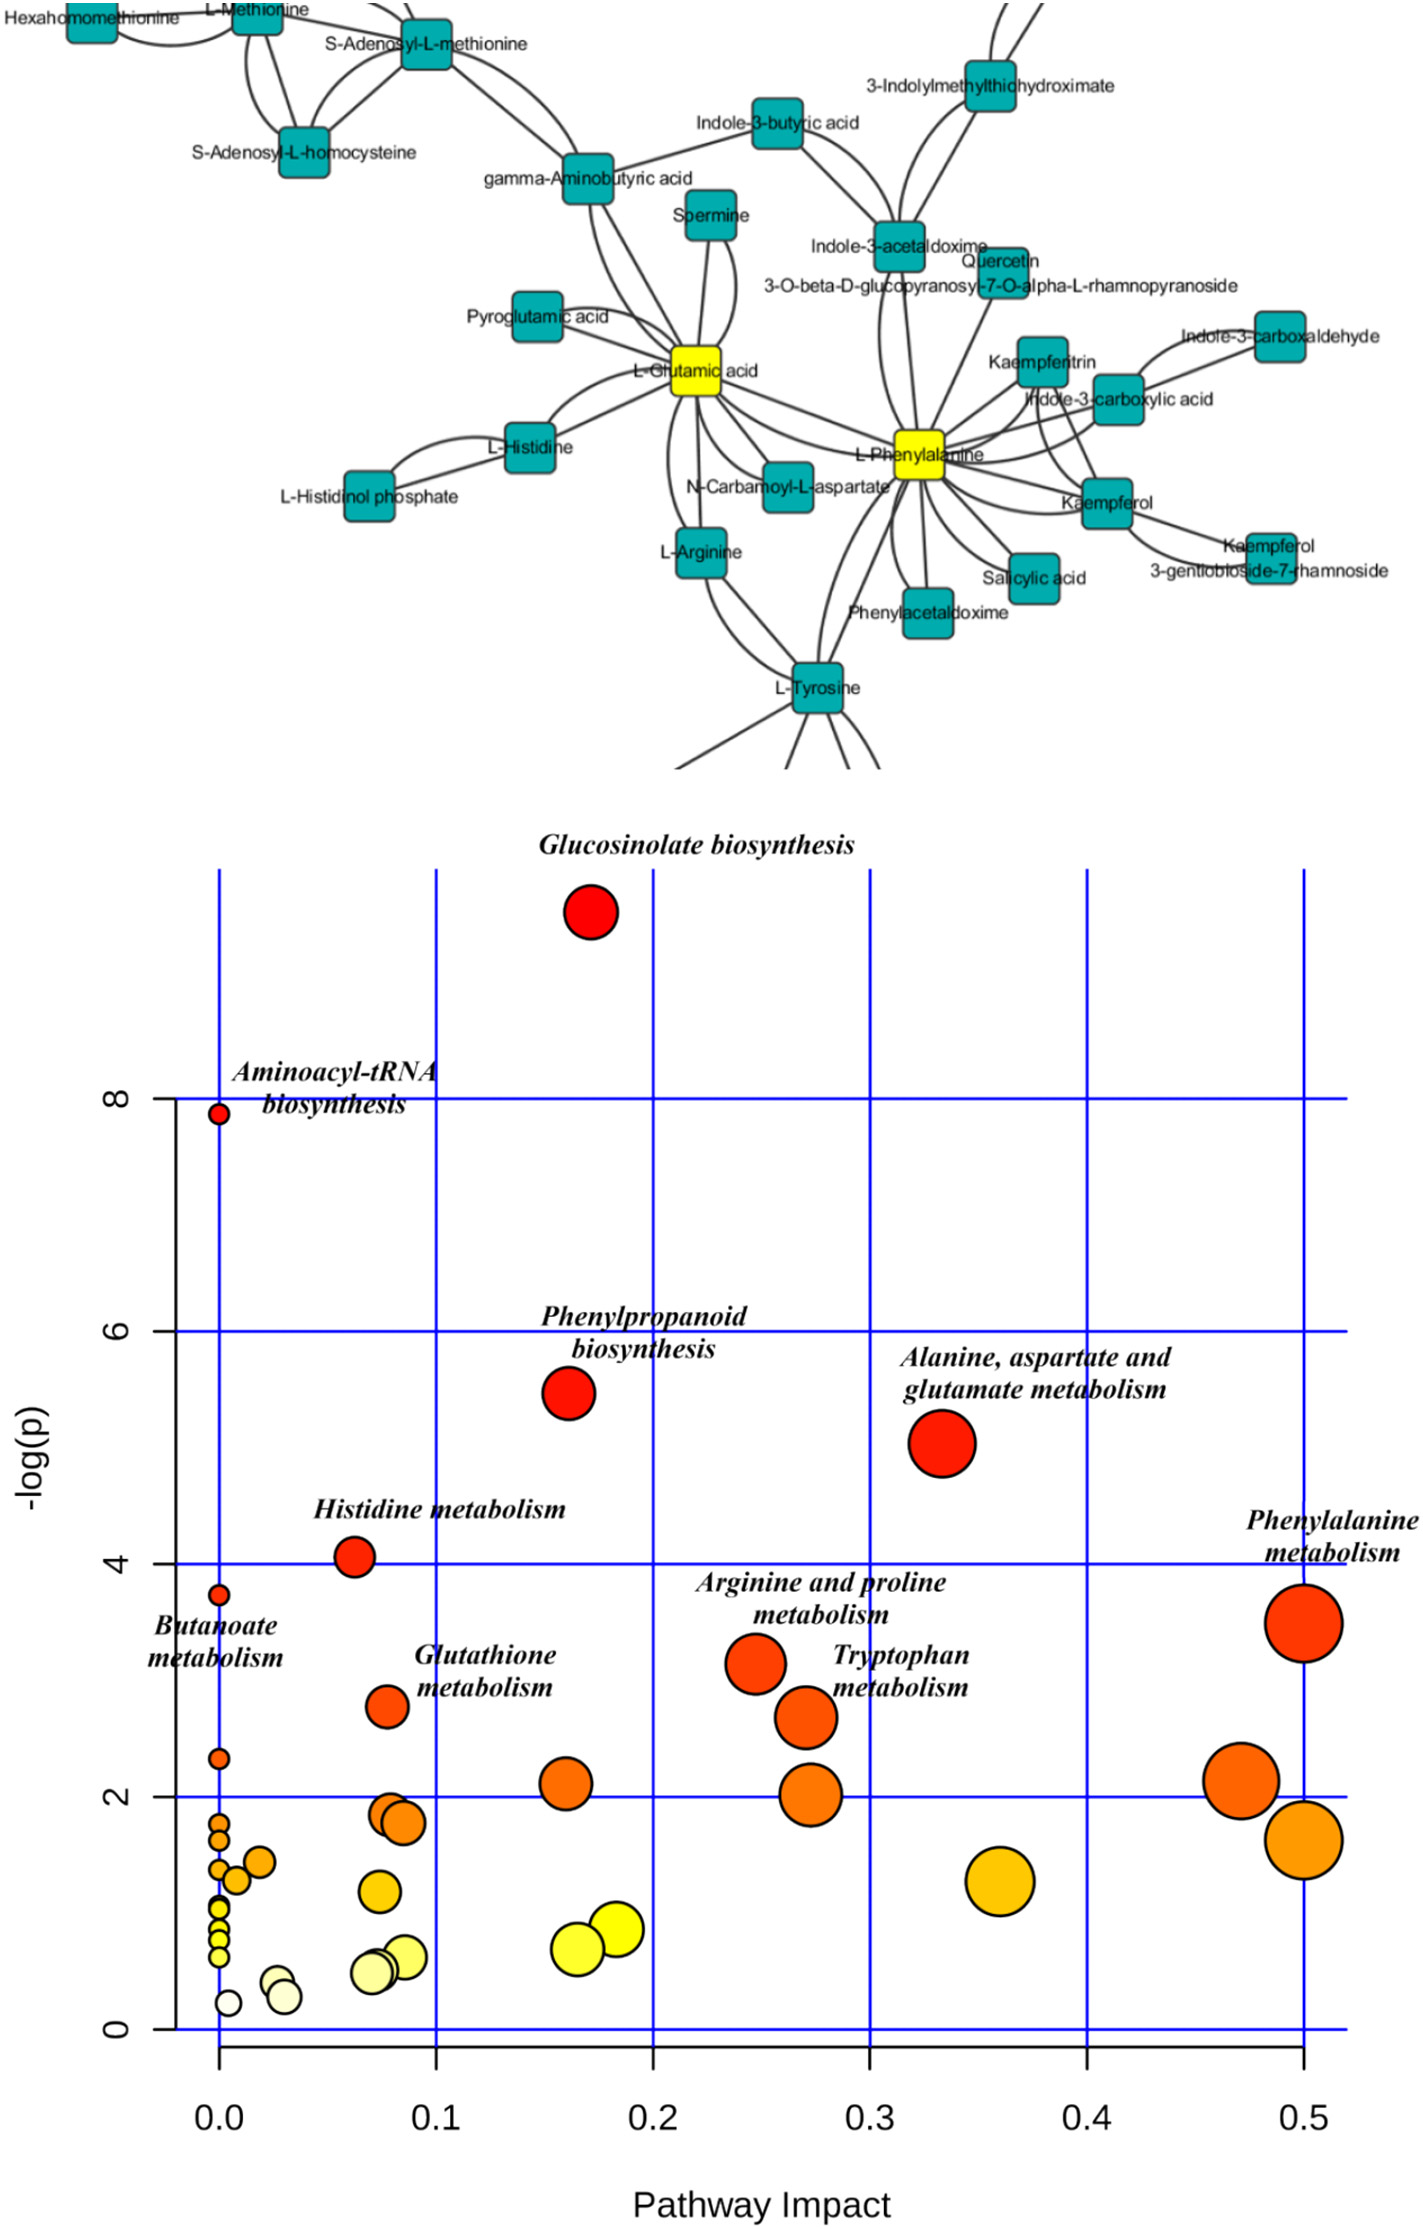
Figure 3.2.2 The most relevant pathways influenced by PFOS based on the pathway analysis (labeled metabolic pathway’s p b 0.05). Metabolic pathway disruption caused by PFOS intervention was further investigated using MetaboAnalyst (https://www.metaboanalyst.ca/) based on significantly different metabolites. Pathway analysis was performed to reveal the most relevant pathways. There were 47 metabolites with identified KEGG (www.kegg.jp/) pathways that showed significant changes after PFOS intervention, and these pathways include glucosinolate biosynthesis, phenylpropanoid biosynthesis, and amino acid metabolism.
Figure 3.2.3 Activation of phenylpropanoid pathway by PFOS exposure
Conclusion
High-throughput nontargeted metabolomic methods were used to identify differential metabolites in A. thaliana leaves exposed to PFOS, and the absorption and toxicity of PFOS at different exposure concentrations in A. thaliana were studied. Fifty-three metabolites were identified as potential biomarkers of the presence of PFOS in plant leaves. The metabolic pathways of the primary and secondary metabolites are affected. The initiation of antioxidation and other defense systems can alleviate the damage triggered by oxidation, thereby stimulating the biosynthesis of defensive compounds, achieving self-protection in plants. However, the study of the oxidative stress and antioxidative mechanism were not far enough for phytotoxicity of PFOS, the interference of phytohormones and glucobrassicin were found indicating that it is necessary to further study on deep phytotoxicity mechanism of PFOS. The results of this study are based on only LC-Q-TOF and a limited range of metabolites. The use of alternative analytical techniques (GC-QTOF and NMR) may supplement comprehensive metabolite information. It is difficult to elucidate the mechanism underlying the toxicity of PFOS in A. thaliana leaves based solely on metabolite information. Multi-omics integration will be helpful to elucidate the physiological mechanisms of plants under PFOS stress.
4. References
[1] Kai Zhang, Yunsheng Han, Qingyu Zhao, Tengfei Zhan, Ying Li, Wenjuan Sun, Shuang Li, Dandan Sun, Xueyang Si, Xiaonan Yu, Yuchang Qin, Chaohua Tang, Junmin Zhang, Targeted Metabolomics Analysis Reveals that Dietary Supranutritional Selenium Regulates Sugar and Acylcarnitine Metabolism Homeostasis in Pig Liver, The Journal of Nutrition, Volume 150, Issue 4, April 2020, Pages 704–711, https://doi.org/10.1093/jn/nxz317
[2] Qiqi Guo, Zeying He, Xiaowei Liu, Bingjie Liu, Yanwei Zhang, High-throughput non-targeted metabolomics study of the effects of perfluorooctane sulfonate (PFOS) on the metabolic characteristics of A. thaliana leaves, Science of The Total Environment, Volume 710, 2020, 135542, ISSN 0048-9697, https://doi.org/10.1016/j.scitotenv.2019.135542.
We also provide customized bioactive screening libraries that allow you to choose the compounds, the sizes, the quantities, the format (powder or solution) and plate map you want in the library
Cyanine dyes are molecules containing polymethine bridges between two nitrogen atoms with a delocalized charge which have been used for many years as dyes in life science. Since the Cy3, Cy5 and Cy7 were made commercially available as succinimidyl esters in the early 1990s, cyanine dyes began to be used widely as labels for nucleic acids. Because of the good properties of low non-specific binding to biomolecules and bright fluorescence owing to their huge extinction coefficients and good quantum yields, the Cy dyes have been widespread used in DNA and RNA labelling. Cyanine dyes can be divided into two groups based on water solubility: non-sulfonated cyanines and sulfonated cyanines.
Non-sulfonated cyanines
Available non-sulfonated dyes include Cy3, Cy3.5, Cy5, Cy5.5, Cy7, and Cy7.5. Cy stands for ‘cyanine’, and the first digit identifies the number of carbon atoms between the indolenine groups. The suffix .5 is added for benzo-fused cyanines. Most derivatives of non-sulfonated cyanines have low aqueous solubility except for hydrochlorides of hydrazides and amines. They are organic co-solvent soluble (5-20% of DMF or DMSO). When these molecules are used for biomolecule labeling, they should be dissolved in organic solvent first, and added to a solution of biomolecule (protein, peptide, amino-labeled DNA) in appropriate aqueous buffer. Fluorescent properties of non-sulfonated cyanines have little dependence on solvent and surrounding.
Sulfonated cyanines
Available sulfonated cyanines include sulfo-Cy3, sulfo-Cy5, and sulfo-Cy7, which have additional sulfo-groups that facilitate dissolution of dye molecules in aqueous phase. Charged sulfonate groups decrease aggregation of dye molecules and heavily labeled conjugates. Sulfonated cyanines are highly water soluble, and they do not use organic co-solvent for the labeling in aqueous environment.
Phos binding reagents (Phosbind) are simple and convenient tools for separation and detection of phosphorylated proteins or peptides.
Protein phosphorylation is an important covalent post-translational modification that can alter the structural conformation of a protein, which then regulates the function, location and specific binding of the target protein. Many cellular processes are regulated by the reversible phosphorylation of proteins and 30% of the proteins are likely to be phosphorylated at some point during their existence.
The determination of the phosphorylation state of proteins is important for defining protein kinase substrates and revealing the activation state of signal transduction pathways. Methods for determining the phosphorylation status of proteins are thus have important implications in the understanding of diverse biological and pathophysiological processes, such as signal transduction pathways, cancer and other diseases.
Phos binding reagents are specific and selective phosphate-binding reagents, and exhibit preferential ionic interactions with phosphorylated ions on phosphorylated proteins or peptides at neutral pH. Phos binding reagent is a dinuclear metal (Zn2+ or Mn2+) complex.
Phosbind Acrylamide is a specific reagent for separation of phosphorylated proteins using SDS-PAGE method. And Phosbind Biotins are specific reagents for detection of phosphorylated proteins using Western Blot and can instead of the specific phosphorylated antibodies.
APExBIO offers affordable custom synthesis of mRNA and long RNA (up to multiple kilobases) with a wide array of modification services at scales ranging from micrograms to milligrams. The mRNA can be generated from DNA templates provided by our customers or we can provide a full service from the ground up. We provide mCAP, ARCA and EZ Cap capping or modified nucleotides implication for all our standard mRNA transcripts.
Modified Nucleotide-containing mRNA Synthesis
In Vitro Synthesis of mRNA (In vitro transcription, IVT)
A 7-methyl guanosine (m7G) cap structure at the 5´ end and a poly(A) tail at the 3´ end are required for mRNA to be translated efficiently in vitro. Capped mRNAs are synthesized by co-transcriptional incorporation of Anti-Reverse Cap Analog (ARCA) via T7 RNA Polymerase. DNase I is used to remove the template DNA, so Poly(A) Polymerase can attach poly(A) tail to capped mRNA. 5-Methyl-CTP, Pseudo-UTP and other modified nucleotides can also be incorporated into mRNA. Synthetic mRNAs are applicable in cell transfection, microinjection, in vitro translation and RNA vaccines etc.
Our custom synthesis mRNA covers a wide range of applications:
mRNA for genome editing, e.g. Zinc-finger Nuclease mRNA, TALEN mRNA, Cas9 mRNA and Recombinase mRNA.
Reporter gene mRNA, such as EGFP mRNA and Luc mRNA, for fluorescence microscopy, flow cytometry and bioluminescent imaging.
Reprogramming mRNA, i.e mRNA for non-integrating generation of iPSC.
mRNAs transcribed in vitro by T7 RNA polymerase may contain various contaminants, such as short RNAs produced by abortive initiation events, double-stranded (ds)RNAs generated by self-complementary 3’extension, as well as unincorporated nucleoside triphosphates, small abortive transcripts and plasmid template. Certain RNA sequences even induce high levels immunogenicity.
APExBIO offers purification service to remove the contaminants of modified nucleotide-containing mRNA, thus increase the processing efficiency for downstream applications.
Silica-gel Membrane Spin Column Purification:
It is a solid phase extraction technique for fast nucleic acid purification. mRNA can be bound to solid phase of silica-gel membranes under certain conditions, with subsequent washing and elution steps in water or TE pH 7. This method eliminates most proteins, DNA and NTPs.
HPLC purification by ÄKTA avant system:
mRNA can be purified by HPLC (ÄKTA avant system) using column matrix of alkylated non-porous polystyrene-divinylbenzene copolymer microspheres and optimized buffer system, followed by mRNA analyses and mRNA isolation from column fractions.
HPLC purification removes dsRNA and other contaminants from in vitro synthesized modified nucleotide-containing mRNAs, yielding mRNA with the high level of translation without generation of immunogenicity or RNA sensor activation.
mRNA and long RNA products
APExBIO supplies the best quality mRNA and long RNA. This new product lines involve custom synthesis of mRNA and long RNA (up to multiple kilobases) with a wide array of modification services at scales ranging from micrograms to milligrams. The mRNA can be generated from DNA templates provided by our customers or we can provide a full service from the ground up. We offer mCAP or ARCA capping or modified nucleotides implication for all our standard mRNA transcripts.
All of our mRNA products offer:
Incorporates an anti-reverse cap analog (ARCA) into the transcript to increase translation efficiency
Reduces host cell immune response and enhances stability by incorporating modified nucleotides (5mCTP and ψUTP) and a poly(A) tail
Degrades the DNA template after RNA synthesis with DNase
Removes the 5’ triphosphates at the end of the RNA with phosphatase to further reduce innate immune responses in mammalian cells
Employs a robust clean-up spin column system that delivers high yields of mRNAs that are ready for most downstream applications
What is necrosis Necrosis is an acute and severe response leading to the premature death of cells consequently damaging nearby Read More...
Nucleosomes
Nucleosome | Stratech What is a nucleosome Nucleosomes are integral components of all eukaryotic genomes with the purpose of organising Read More...
Autophagy
What is Autophagy? Autophagy (namely self-eating) is a highly conserved process for disassembling intracellular excess and dysfunctional components such as Read More...
Apoptosis
What is Apoptosis Apoptosis is a form of programmed cell death that occurs in multicellular organisms and has multiple functions Read More...
WNT Pathways
What is the Wnt Pathway? The Wnt pathway is a highly conserved signally pathway regulated by a series of Wnt Read More...
Real-Time qRT-PCR and qPCR reagents for COVID-19 research
Request a QuoteTechnical SupportPlace an Order Below is a comprehensive list of all our Real-Time qRT-PCR and qPCR reagents for Read More...
COVID-19 Research Products (Proteins, Antibodies, ELISA and cDNA)
Contact usPlace an Order Below is a comprehensive list of all our COVID-19 research products broken down into main product Read More...
Try SYBR Safe DNA Gel Stain free of charge and move away from ethidium bromide. SYBR Safe DNA Gel Stain Read More…
Screening Libraries
Compound Library Advantages Cost-effective and competitive price to save your findings. Potent, selective and cell-permeable in inhibiting or activating target Read More...
Definitions of commonly used pharmacological terms
We specialize in small molecule inhibitors, agonists, antagonists and screening libraries! Term Description Agonist A drug that binds to and Read More…
Apexbio FAQs
If your questions are not listed below, please contact technical support: technical@stratech.co.uk Common Questions 1. How should I dissolve the product Read More...