Conjugation of Proteins to Zepto Ultra Express Fluorescent Microspheres
Zepto™ Ultra Express Microspheres are metal-coated fluorescent polystyrene beads designed for fast surface functionalization with molecules containing primary amines, tiol or dithiol groups. The procedure is simply a mix-and-use process.
The following protocol provides general guidelines for conjugation of antibodies to Zepto™ Ultra Express Microspheres, and their use in downstream assays. Multiple antibodies of different specificities, or other molecules of interest, may be conjugated to microspheres emitting different fluorescent colours, allowing for multiplexed detection capabilities in a single assay.
Conjugation Protocol
Fluorescent Microspheres: Zepto™ Ultra Express Microspheres
- Vortex the product bottle before use to ensure homogeneous suspension of the microspheres.
- Immediately aliquot 1 million microspheres (10 µL of stock solution as provided).
- Add 10 µL of IgG .*
- Mix well and incubate for 2 hours at room temperature with constant rotation.
- Add 100 µL of washing buffer and mix well.
- Gently pellet at 100 g for 5 min and discard supernatant. **
- Add 100 µL of storage buffer and mix well.
- Incubate for 1 hour at room temperature with constant rotation.
- Conjugated microspheres are now ready for your use in your assay. Alternatively, store at 4°C until use.
** The centrifugation speed for pelleting microspheres is a range between 100 to 500 g. A lower/more gentle centrifugation speed with longer time is recommended to form a good microsphere pellet, especially after conjugation to a protein. Prolonged centrifugation at high speed may cause irreversible aggregation and loss of performance.
Detection Assay
The following procedure is based on a sandwich assay for single analyte detection using flow cytometry. Capture antibodies are conjugated to the microsphere surface as described above. A reporter is typically a fluorophore-labelled antibody that recognizes and binds to a different domain or epitope on the analyte than that of the capture antibody. In the presence of analyte, a sandwich is formed when the microspheres coated with the capture antibody and the reporter antibody bind the analyte.
The protocol below is a general guideline and users may need to optimize assay parameters for their particular application to obtain optimal performance.
- Aliquot 0.5 µL of conjugated spheres as prepared above (equals about 5,000 microspheres)
- Add 5 µL of reporter antibody (50 µg/mL in TBS, 0.1% BSA)
- Add 100 µL of analyte standard or sample solution and mix well
- Incubate for 1 hour at room temperature with constant rotation
- Add 500 µL of washing buffer and mix well
- Gently pellet at 100 g for 5 min
- Discard supernatant, add 500 µL of washing buffer and mix well
- Gently pellet at 100 g for 5 min
- Resuspend microspheres in washing buffer and analyze by flow cytometry
Background
Gold nanoparticles present distinct optical and physical properties, which are dependent upon their size (diameter), shape, surface structure and agglomeration state. When handling gold nanoparticles, especially when functionalizing their surface with chemical groups or biomolecules, it is often necessary to characterize them, e.g., to evaluate the result of surface modification. This tech note describes some basic techniques for characterizing gold nanoparticles and their modification.
Ultraviolet-Visible (UV-Vis) Spectroscopy
Gold nanoparticles exhibit a distinct optical feature commonly referred to as localized surface plasmon resonance (LSPR), that is, the collective oscillation of electrons in the conduction band of gold nanoparticles in resonance with a specific wavelength of incident light. LSPR of gold nanoparticles results in a strong absorbance band in the visible region (500 nm-600 nm), which can be measured by UV-Vis spectroscopy.
The LSPR spectrum is dependent both on the size (figure 1), and shape (figure 2) of gold nanoparticles. The peak absorbance wavelength increases with particle diameter, and for uneven shaped particles such as gold nanourchins, the absorbance spectrum shifts significantly into the far-red region of the spectrum when compared to a spherical particle of the same diameter.
The peak optical density (OD), or absorbance of the sample, correlates linearly to the concentration of nanoparticles in solution. To correlate the OD value of each size of particles with their concentration (particles/ml), please refer to table 1 below, where an OD value of 1 (with a 1 cm path length) applies to nanoparticles between 5 nm and 100 nm.
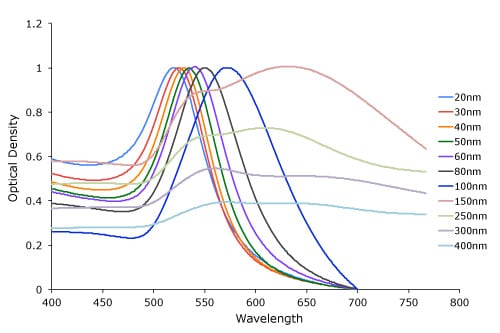
Figure 1. Gold nanoparticle size dependant surface plasmon resonance. Note the red-shift of the absorption maximum as the gold nanoparticle size increases.
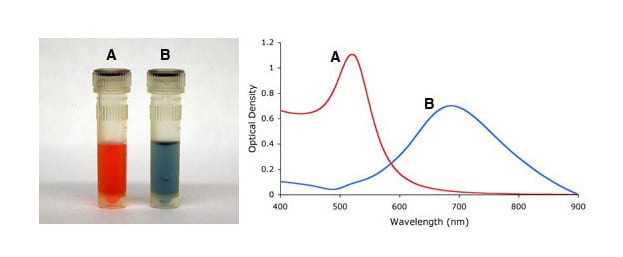
Figure 2. Gold nanoparticle shape dependant localized surface plasmon resonance as indicated by the visual appearance and UV-VIS spectra of spherical (A), and urchin-shaped (B) gold nanoparticles (“spiky gold”).
UV-VIS measurements can also be used to evaluate the functionality of gold nanoparticles. Upon binding of ligands to the gold nanoparticle surface, the LSPR spectrum will red-shift by a few nanometers, as shown in Figure 3. This shift is a result of an increase in the local refractive index at the gold nanoparticle surface, and is the basis of label-free SPR biosensing. For particles with uneven shapes such as gold nanourchins or gold nanorods this local refractive index change is more profound due to a further enhancement of the electromagnetic field at points of “unevenness” at the particle surface.
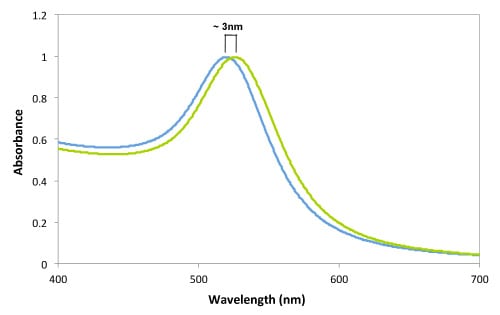

Figure 3. UV-VIS spectrum of 20nm gold nanoparticles, before (blue) and after (green) conjugation to an antibody. Note the 3nm red-shift of the LSPR peak while maintaining the overall shape and intensity of the spectra indicating successful conjugation of the antibody to the gold surface.
Similarly, aggregation states of gold nanoparticles, i.e., irreversible inter-particle coupling, are also accompanied by a red-shift in the spectrum, as well as broadening of adsorption peaks, and a decrease in peak intensities. Aggregation states are also visibly detected by a change in colour of the solution from red to blue/purple, as shown in Figure 4. UV-Vis measurements thus provides a simple method to assess the stability of gold nanoparticles, which can be applied to monitor their quality over time as well as evaluating the integrity of the colloidal solution when performing surface modifications. For example, non-functionalized gold nanoparticles aggregate upon the addition of NaCl but when the gold surface is completely shielded by a layer of a conjugated protein aggregation can be prevented.
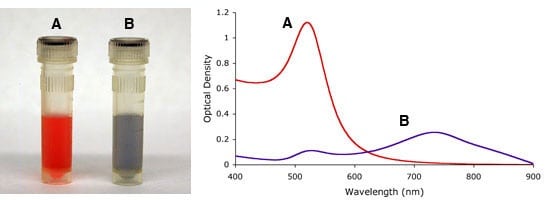
Figure 4. Visual appearance (left) and UV-Vis spectra (right) of monodisperse (A) and sodium chloride (NaCl) induced heavily agglomerated (B) 15nm gold nanoparticles.
Dynamic Light Scattering (DLS)
Dynamic light scattering (DLS) is an analytical technique used for measuring the size and size distribution of submicron-sized particles. In the measurement, a particle suspension is illuminated by a laser beam, and the fluctuation of scattered light is monitored and analysed, to acquire the velocity of the particles’ Brownian motion and thereby inferring their size.
DLS measures the hydrodynamic size of particles, which includes not only the physical size of the nanoparticle core, but also the surface coating and solvent layer associated with the particle. Therefore, the conjugation of molecules such as PEG, proteins, or oligonucleotides to the gold nanoparticle surface increases their hydrodynamic size. This technique therefore provides another tool to evaluate surface modifications. Figure 5 shows the change of 20 nm gold nanoparticles upon binding of a PEG layer.
Aggregation of gold nanoparticles can also be measured with DLS. While non-aggregated monodispersed gold nanoparticles are measured with DLS as a single size population, aggregation of the particles can present a broadening of the peak, increase in hydrodynamic size, and even multiple populations.
DLS measurements of gold nanoparticles is a very sensitive technique and can be applied not only to measure the size of particles, characterizing surface modification, monitoring the stability of gold nanoparticles over a period of time, but also as a detection approach for bio-assays.
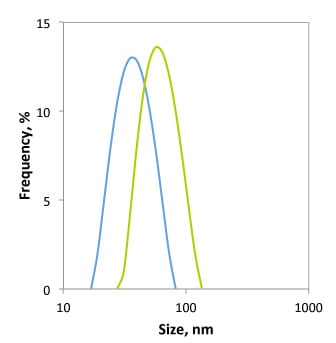
Figure 5. Size histogram obtained by dynamic light scattering measurement of 20 nm gold nanoparticles before (blue) and after (green) surface functionalization with a 3kDa PEG-thiol. The hydrodynamic size increased from 30 nm to 48 nm through the addition of a PEG-layer.
Microscopic Imaging of Gold Nanoparticles
While the limit of resolution of optical microscopy is only sub-micron, electron microscopy, such as Transmission Electron Microscopy (TEM) and Scanning Electron Microscopy (SEM), have a resolution down in the sub-nanometer range. TEM is typically used to determine the physical size and structural morphology of gold nanoparticles. TEM is also a commonly used detection method in immunohistochemistry protocols using gold conjugate detection probes. TEM is also a good technique for studying cellular uptake of gold nanoparticles.
Another important microscopic approach for imaging gold nanoparticles is dark field microscopy. Because of the strong surface plasmon resonance light scattering, gold nanoparticles can be visualized as bright points under a dark field microscope. The colour displayed is determined by the peak SPR wavelength. As shown in the dark field microscopy images in Figure 6, spherical gold nanoparticles appear green and gold nanourchins appear red, due to their peak SPR and scattering in the 500 nm and 600 nm range, respectively.
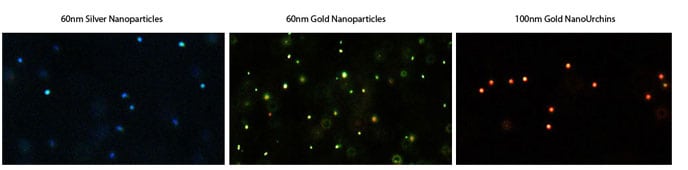
Figure 6. Darkfield microscopy images of silver, gold and gold nanourchin nanoparticles. Note how the wavelength of scattered light changes with nanoparticle composition and nanoparticle shape.
Gel Electrophoresis
Gel electrophoresis is a common analytical technique that separates macromolecules or particles based on their size, shape and charge. It is a powerful tool for analysing gold nanoparticles and their surface modification. The distinct colour of gold nanoparticles and other noble metal nanoparticles enables direct observation of the sample and its migrations within the gel.
Modification of the gold surface with charged ligands or molecules such as amine-PEG, carboxyl-PEG oligonucleotides or proteins generally results in a change in the surface charge, which can be seen by an altered migration pattern (direction or migration distance) in agarose gel electrophoresis, see figure 7. Also, surface coating of biomolecules such as protein increase the size of the nanoparticles thereby slowing down their electrophoretic speed when compared to unmodified gold nanoparticles.
Gel electrophoresis can thus be effectively used in optimizing the conjugation conditions of molecules onto gold nanoparticles, by revealing the point of saturation beyond which increased loading of molecules causes no further migration shift of the band. Agarose gel electrophoresis can also be used for separation followed by isolation and purification of individual components after functionalization.
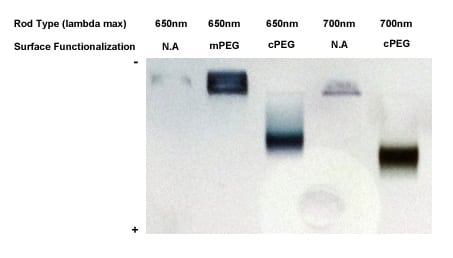
Figure 7. Agarose gel analysis of two types of gold nanorods functionalized with either methoxy-PEG-SH or carboxyl-PEG-SH. Not the change in migration pattern between the mPEG and cPEG functionalized samples due to an increased negative charge of the resulting particles. Also, the 700nm absorbing cPEG functionalized gold nanorods migrate faster in the gel than the 650nm cPEG functionalized rods due to their overall smaller size.
Bio-Functionality Testing
Gold nanoparticles are often conjugated with biomolecules to serve as probes in various bioassays. It is not only important to ensure the proper conjugation and stability using aforementioned methods such as UV-Vis measurement, but it is also essential to confirm the functionality of the conjugate, i.e., specific binding of target analytes.
One simple method to evaluate the functionality of gold conjugate is through immunoblotting. Briefly, a serial dilution of the analyte to be detected is spotted on a nitrocellulose membrane followed by the addition of the conjugate of interest. If the gold conjugate is functional, binding to the spotted analyte will occur, which is conveniently visualized by a bright red colour, see figure 8. Further amplification of the signal can also be accomplished with silver enhancement.
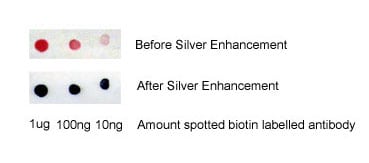
Figure 8. Binding of 20nm streptavidin labelled gold nanoparticles to a biotinylated antibody spotted on a nitrocellulose membrane before and after silver enhancement.
Table I. Summary of optical and physical properties of Cytodiagnostics spherical standard gold nanoparticles.
| Diameter (nm) |
Peak SPR Wavelength (nm) | NPS/ml | Wt. Conc (mg/ml) | Molar Ext (M-1cm-1) | Size Dispersity (+/-nm) | Particle Volume (nm3) |
Surface Area (nm2) | Surface/ Volume Ratio |
Particle Mass (g) | Molar Mass (g/mol) | Molar Concentration |
| 5 | 515-520 | 5.47E+13 | 6.94E-02 | 1.10E+07 | <15% | 6.54E+01 | 7.85E+01 | 1.200 | 1.27E-18 | 7.64E+05 | 9.08E-08 |
| 10 | 515-520 | 5.98E+12 | 6.07E-02 | 1.01E+08 | <15% | 5.24E+02 | 3.14E+02 | 0.600 | 1.02E-17 | 6.11E+06 | 9.93E-09 |
| 15 | 520 | 1.64E+12 | 5.61E-02 | 3.67E+08 | <12% | 1.77E+03 | 7.07E+02 | 0.400 | 3.43E-17 | 2.06E+07 | 2.72E-09 |
| 20 | 524 | 6.54E+11 | 5.31E-02 | 9.21E+08 | <12% | 4.19E+03 | 1.26E+03 | 0.300 | 8.12E-17 | 4.89E+07 | 1.09E-09 |
| 30 | 526 | 1.79E+11 | 4.91E-02 | 3.36E+09 | <12% | 1.41E+04 | 2.83E+03 | 0.200 | 2.74E-16 | 1.65E+08 | 2.98E-10 |
| 40 | 530 | 7.15E+10 | 4.65E-02 | 8.42E+09 | <12% | 3.35E+04 | 5.03E+03 | 0.150 | 6.50E-16 | 3.91E+08 | 1.19E-10 |
| 50 | 535 | 3.51E+10 | 4.45E-02 | 1.72E+10 | <10% | 6.54E+04 | 7.85E+03 | 0.120 | 1.27E-15 | 7.64E+08 | 5.83E-11 |
| 60 | 540 | 1.96E+10 | 4.30E-02 | 3.07E+10 | <10% | 1.13E+05 | 1.13E+04 | 0.100 | 2.19E-15 | 1.32E+09 | 3.25E-11 |
| 70 | 548 | 1.20E+10 | 4.17E-02 | 5.03E+10 | <10% | 1.80E+05 | 1.54E+04 | 0.086 | 3.48E-15 | 2.10E+09 | 1.99E-11 |
| 80 | 553 | 7.82E+09 | 4.06E-02 | 7.70E+10 | <10% | 2.68E+05 | 2.01E+04 | 0.075 | 5.20E-15 | 3.13E+09 | 1.30E-11 |
| 90 | 564 | 5.37E+09 | 3.97E-02 | 1.12E+11 | <8% | 3.82E+05 | 2.54E+04 | 0.067 | 7.40E-15 | 4.46E+09 | 8.92E-12 |
| 100 | 572 | 3.84E+09 | 3.89E-02 | 1.57E+11 | <8% | 5.24E+05 | 3.14E+04 | 0.060 | 1.02E-14 | 6.11E+09 | 6.37E-12 |
| Diameter (nm) |
NPS/ml | Wt. Conc (mg/ml) | Size Dispersity (+/-nm) | Particle Volume (nm3) |
Surface Area (nm2) | Surface/ Volume Ratio | Particle Mass (g) |
Molar Mass (g/mol) | Molar Concentration |
| 150 | 3.60E+09 | 1.20E-01 | <8% | 1.77E+06 | 7.07E+04 | 0.040 | 3.43E-14 | 2.06E+10 | 5.98E-12 |
| 200 | 1.91E+09 | 1.55E-01 | <8% | 4.19E+06 | 1.26E+05 | 0.030 | 8.12E-14 | 4.89E+10 | 3.17E-12 |
| 250 | 7.08E+08 | 1.13E-01 | <8% | 8.18E+06 | 1.96E+05 | 0.024 | 1.59E-13 | 9.55E+10 | 1.18E-12 |
| 300 | 4.50E+08 | 1.24E-01 | <8% | 1.41E+07 | 2.83E+05 | 0.020 | 2.74E-13 | 1.65E+11 | 7.48E-13 |
| 400 | 1.88E+08 | 1.22E-01 | <8% | 3.35E+07 | 5.03E+05 | 0.015 | 6.50E-13 | 3.91E+11 | 3.12E-13 |
Your first choice for scientific solutions
Find out moreSUPPORT
outstanding technical support
PRODUCT
we offer a full product guarantee
DELIVERY
we offer free delivery to UK universities and non profit organisations