ExoQuick ULTRA EV Isolation Kit for Serum and Plasma
Catalogue Number: EQULTRA-20A-1-SBI
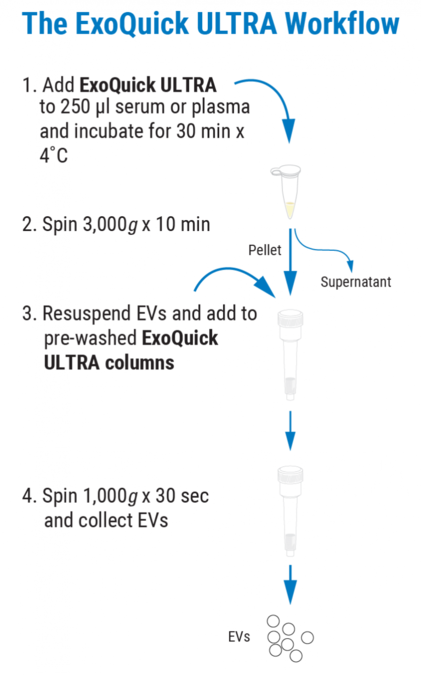
Exoquick Ultra Workflow
ExoFlow Ultra Supporting Data
EQULTRA-20A-1 Image
EQULTRA-20A-1 Image
Exoquick Ultra Workflow
ExoFlow Ultra Supporting Data
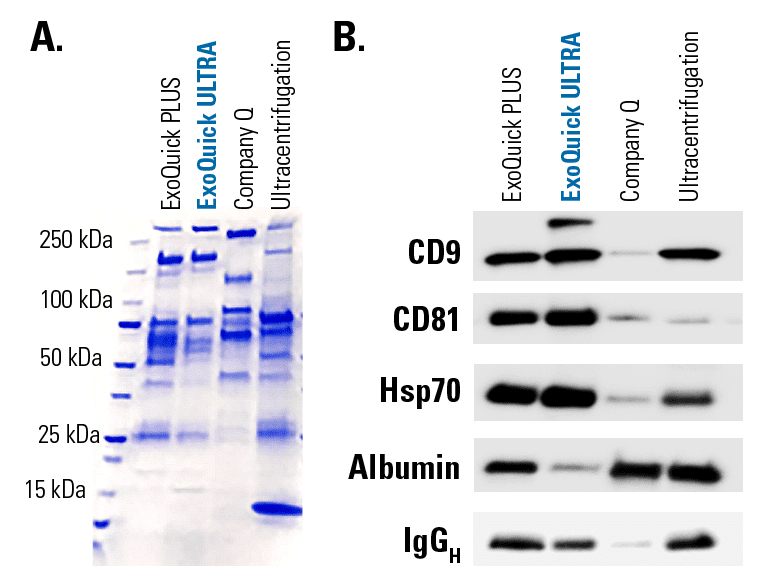
Figure 1. ExoQuick ULTRA delivers high yields of clean exosomes. (A) A coomassie blue-stained protein gel comparing the protein content of exosome preps isolated using different methods shows only a few, defined protein bands in the ExoQuick ULTRA lane compared to the other methods. (B) Western blotting of the gel shows that the ExoQuick ULTRA prep contains the highest levels of exosome-specific markers CD9, CD81, and Hsp70 and the lowest levels of the carryover proteins albumin and IgGH. In contrast, the prep from Company Q appears to be primarily albumin, and even the sample prepared using ultracentrifugation contains considerably higher levels of both albumin and IgGH. Each lane was loaded with 7 μg of total protein as measured using a fluorometric Qubit protein assay.
EQULTRA-20A-1 Image
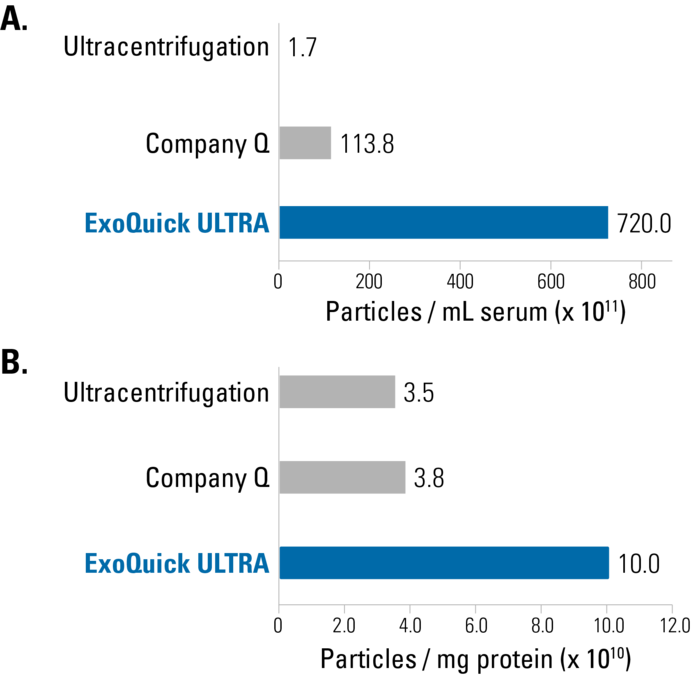
Figure 2. Fluorescent nanoparticle tracking analysis (fNTA) demonstrates the high EV yields delivered by ExoQuick ULTRA compared to Ultracentrifugation. Comparison of different isolation methods on EV yields by both volume of input serum (per mL, A) and amount of input serum protein (per mg as measured by fluorometric Qubit protein assay, B). Particle number was measured using fNTA, a technique which specifically detects EVs (see how to use fNTA to measure EV concentration at our ExoGlow-NTA page).
EQULTRA-20A-1 Image
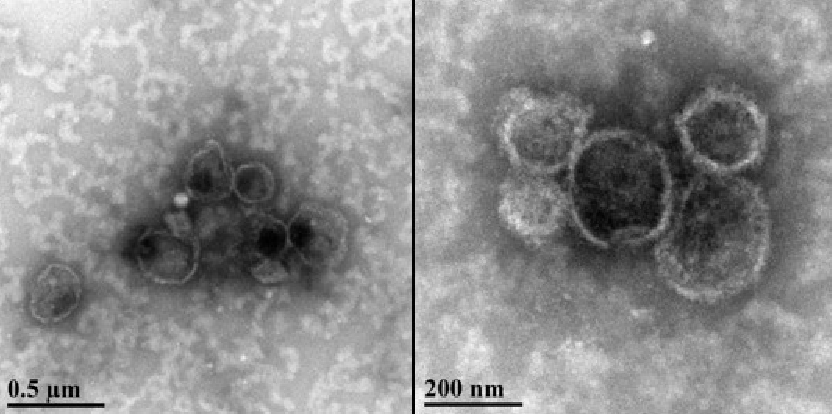
igure 3. EVs isolated using ExoQuick ULTRA display typical EV morphology. Transmission electron micrographs of EVs isolated from human serum using ExoQuick. The same sample is shown at two different magnifications. Multiple vesicles with typical EV morphology can be seen in each image.
| Manufacturer: | System Biosciences |
| Shelf Life: | 12 months |
| Type: | Exosome Tools |
| Shipping Condition: | Blue Ice |
| Unit(s): | 20 reactions |
| Range: | |
| Sensitivity: | |
| Sample type: | |
| Sample size: |
SUPPORT
outstanding technical support
PRODUCT
we offer a full product guarantee
DELIVERY
we offer free delivery to UK universities and non profit organisations